Want to grow your business with competitor traffic analysis? You’re in the right place.
In this article, you’ll learn how to analyze your competitors’ website traffic, why this strategy works, and which tools give you the most accurate data.
Tip: Create a free Semrush account (no credit card needed) to follow along with the steps in this guide.
What Is Competitor Traffic Analysis?
Competitor traffic analysis is the process of analyzing your competitors’ website traffic and using the data to improve your own website performance. There are many tools that can help you do competitor analysis, including Semrush’s Traffic & Market Toolkit.
A toolkit like Traffic & Market tools can provide you with various metrics and insights, such as:
- How much traffic your competitors are driving
- If their audience is growing or declining
- Which channels drive the most traffic
- What user experience looks like (i.e., average visit duration and bounce rate)
- Visitor demographics and locations that bring in the most traffic
- Which pages users visit after visiting their websites
- And lots more.
Essentially, competitive intelligence helps you see what’s already working for others. And build upon that success.
Can You Really Track Competitor Website Traffic?
For your own website’s traffic data, Google Analytics is the most comprehensive and accurate tool.
But it won’t do the trick for your competitors.
You can check a competitor’s site traffic, but you need a specific tool. Like Semrush’s Traffic & Market Toolkit.
The Traffic & Market toolkit provides a plethora of dashboards that provide various types of traffic data that can reveal your competitors:
- Website traffic
- Visitor engagement
- Traffic channel breakdowns
- AI traffic trends
- User journey
- Top pages
- Audience demographics
- And more

The tool leverages clickstream data (data about the pages a user visits) from multiple proprietary and third-party data sources.
Then, it uses an AI algorithm to accumulate, clean, and process the raw data from over 200M+ internet users.
In this article, we’ll show you have to analyze competitor website traffic using a tool like Semrush’s Traffic & Market Toolkit, showing how to gather, analyze, and apply the data to your strategy.
How to Analyze Competitor Website Traffic
Data can tell a story.
It can tell you whether visitors are finding what they’re looking for. Or if your new partnership is paying off.
Among many other things.
Which means insights drawn from competitor data can help you outcompete them. And earn more traffic.
Let’s take a look at a few tactics you can use.
Measure Competitor Website Traffic
Let’s start with a broad view. It helps lay the foundation for more in-depth research later on.
So, first, enter competitor websites into the Traffic Overview dashboard, and begin exploring.

You’ll quickly see estimates of the site’s traffic and engagement. And how they’ve increased or decreased over time.
Here’s a quick overview of what each metric means:
- Visits: the estimated total visits to the website during that month
- Unique Visitors: the estimated total unique visitors to the website during that month
- Purchase Conversions: The percentage of traffic to the website that leads to a conversion
- Pages/Visit: the average number of pages a person visits in one session on the website
- Avg. Visit Duration: the average amount of time visitors spend on the website
- Bounce Rate: The percentage of visitors who leave the website after seeing just one page

Note: The Traffic & Market Toolkit provides estimated data. For your own website's real numbers, use Google Analytics.
Now let’s dive a little deeper.
The Traffic & Market Toolkit provides dasbhoards for key traffic channels–AI traffic, referral, organic, paid, email, display ads–allowing you to dive deeper into channel spacific metrics and strategies.
For example, AI assistants are becoming the gateway to online discovery, and understanding how tools like ChatGPT, Gemini, Claude, and Perplexity reference and recommend competitors is becoming just as critical as ranking in search engines.
With Semrush’s AI Traffic dashboard you can track how these assistants mention and recommend competitor brands across time, platforms, and geographies.
Together, these dashboards reveal not just how much traffic competitors get—but where it’s coming from and how it impacts their overall success.
Examine Traffic Trends Across Time
Scroll further down in the Traffic Overview dashboard and you’ll see a Traffic Trend chart.
Like so:

It shows the same broad metrics we saw before, but depicted over time. Which can help spot any competitor trends and provides a forecast of what they expect to see in May.
Next, view the Traffic Channel Trend graph, which shows traffic trends for key channels such as referral, search, social, email, and more.

For example, are there spikes or significant drops in organic traffic? If so, are they seasonal (do they happen every year)? Does it affect all the websites you’re comparing?
Think about what could’ve caused them.
Especially for spikes. Did a competitor do something special? Was it due to a campaign they ran?
Learning what caused spikes can help you see what works. Then, you can mimic your competitors’ strategies and win some traffic yourself.
Likewise, discovering what caused drops in traffic can help you learn what you should avoid.
Compare Website Traffic Customer Experience
Now let’s compare user experience across your competitors — using Pages per Visit, Avg. Visit Duration, and Bounce Rate metrics.
These are available directly in the Traffic Overview or through the Daily Trends dashboard for more granular views.

You’ll quickly see how these user experience metrics compare.
Analyzing these metrics is important because, sometimes, seeing a high number of visitors can be deceiving. It doesn’t paint the full picture.
Comparing these engagement metrics can give you a better understanding of how users are behaving. And if they’re finding what they need.
For example, has a competitor’s bounce rate worsened over time?
If so, this could mean:
- Users aren’t finding the content interesting or helpful
- A promoted offer isn’t as good is it seems
- Traffic is coming from countries where the product or service isn’t available
Tracking these metrics over time can reveal who is winning when it comes to serving customers what they want.
And can help you learn from what is working and steer clear of what is not.
Track User Sources & Journeys
Sticking with the Traffic Overview dashboard, scroll to view the Traffic Journey chart—it shows where users come from and where they go after competitor sites.

You can then look at the Traffic Channel Dashboards to explore journey charts focused on each specific source, like Organic Search, Referral, or Paid Social.

Finally, head to the Sources & Destinations dashboard to go deeper. Use the graphs and tables to organize traffic by channel and category, compare competitors, and spot trends in user behavior.

Explore Top Pages, Subdomains, and Subfolders
First, to see your competitors' top pages head to the Top Pages dashboard.
You’ll see a report with detailed data. Including page views, unique visitors, traffic channels for each page, and a variety of sorting options.

To search for specific pages (those promoted on organic social media or with paid social ads), filter according to the traffic channel to bring those pages to the top.
Like this:

You can also filter by page. And see the actual page by clicking on it.
For example, we sorted Nike pages by the word “sandals.”

As the graph shows, the page selected focuses on “Jordan Dydrip Big Kid Sandals.” And receives a lot of organic social traffic.

Which means you now have insights into Nike’s marketing strategy.
Finally, head to the Subdomains & Subfolders dashboard to see your competitor’s top subfolders and subdomains by traffic and channel.
Like this:

Use this information to determine if you should focus on creating similar subfolders or subdomains.
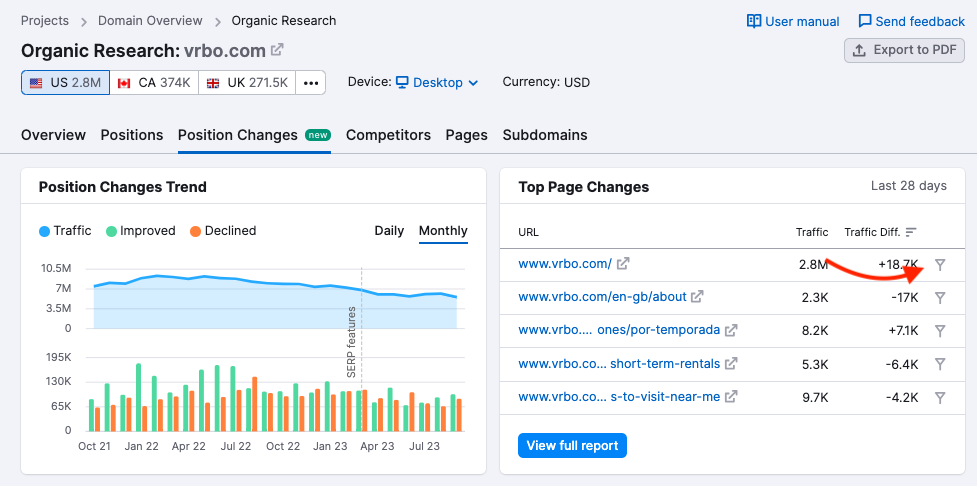
Pro tip: Another tool you can use to monitor traffic changes easily is Organic Research.

Start by entering the domain name you would like to examine. Navigate to the “Position Changes” tab and then look at the “Top Page Changes” widget to see the domain’s pages with the most change in estimated traffic.

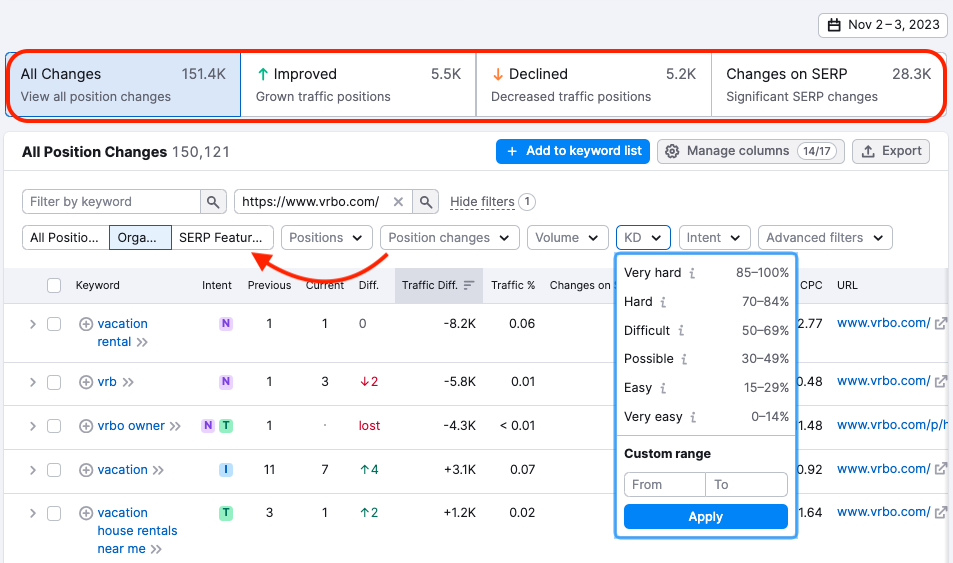
You can click on the built-in filter icon to be taken to the “All Position Changes” report.
This report has several preset filters about the keywords your competitor is gaining or losing traffic to (plus more). This makes it easy to isolate certain metrics for more thorough analysis.
You can even see if they have been dropped in or out of a SERP feature.
Once you’ve got the specific data you’re looking for, you can export this report using a customizable date range. Click the “Export” button to send the information to an Excel spreadsheet, CSV, or CSV Semicolon.

Further reading:
Generate Audience Insights
The Audience Overlap dashboard is a great starting place for understanding how your market’s audience interacts with you and your competitors.
The overlap graph shows the size of your competitors' audience. And the extent to which their audiences overlap.

The largest circle belongs to nike.com, indicating they have the largest audience. They share the largest overlap with adidas.com, meaning 3.5M people who visited nike.com also visited adidas.com.

Using this information, you might learn who you could partner with or which audiences to target to grow your traffic.
Note: For more detailed data, you can also explore the Demographics dashboard (for age, gender, geo, and unique visitors), and Countries, USA States, or Business Regions dashboards — depending on the level of detail you need.
Track Competitor Web Traffic Globally
The Countries dashboard shows information about audiences worldwide.
For a general picture of a competitor’s global web traffic, start by analyzing the Traffic Map.

Also, check the Trend by Visits graph to understand how traffic flows to various countries across time.

The graph above shows the growth trend in various countries. For example, notice the spike in traffic from Mexico in early May. It might be a good idea to do some more research into this specific market.
And the Traffic by Country table below shows data for specific locations. Each entry has a drop-down tab that shows top website pages in that country.

Considering the Mexican market again, the market seems to be growing. And may be a good target for future growth.
Take Competitor Analysis a Step Further
Checking competitor website traffic is a smart way to boost your own website’s traffic.
But you shouldn’t stop there.
Conducting a more thorough competitor analysis can help you capitalize on their weaknesses, replicate their strengths, and prioritize tasks.
For example, you can run a keyword gap analysis to find keywords your competitors are ranking for but you aren’t.
Or find sites that link to your competitors but not to you. Or discover their best-performing pages to create something better or similar.
Check out Semrush’s Traffic & Market Toolkit to stay ahead of the game.