The Sources & Destinations dashboard is part of the Semrush Traffic & Market Toolkit, designed to show where traffic to and from selected domains comes from and goes next.
Use this dashboard to understand the broader user journey—what sites send traffic to your competitors, and where those users go afterwards. This visibility can inform everything from acquisition strategies to partnership decisions.
Getting started with the Sources & Destinations dashboard
The Get Started menu is your entry point into the Semrush Traffic & Market Toolkit. It’s designed to help you quickly enter domains and move into your analysis of their traffic and marketing performance.
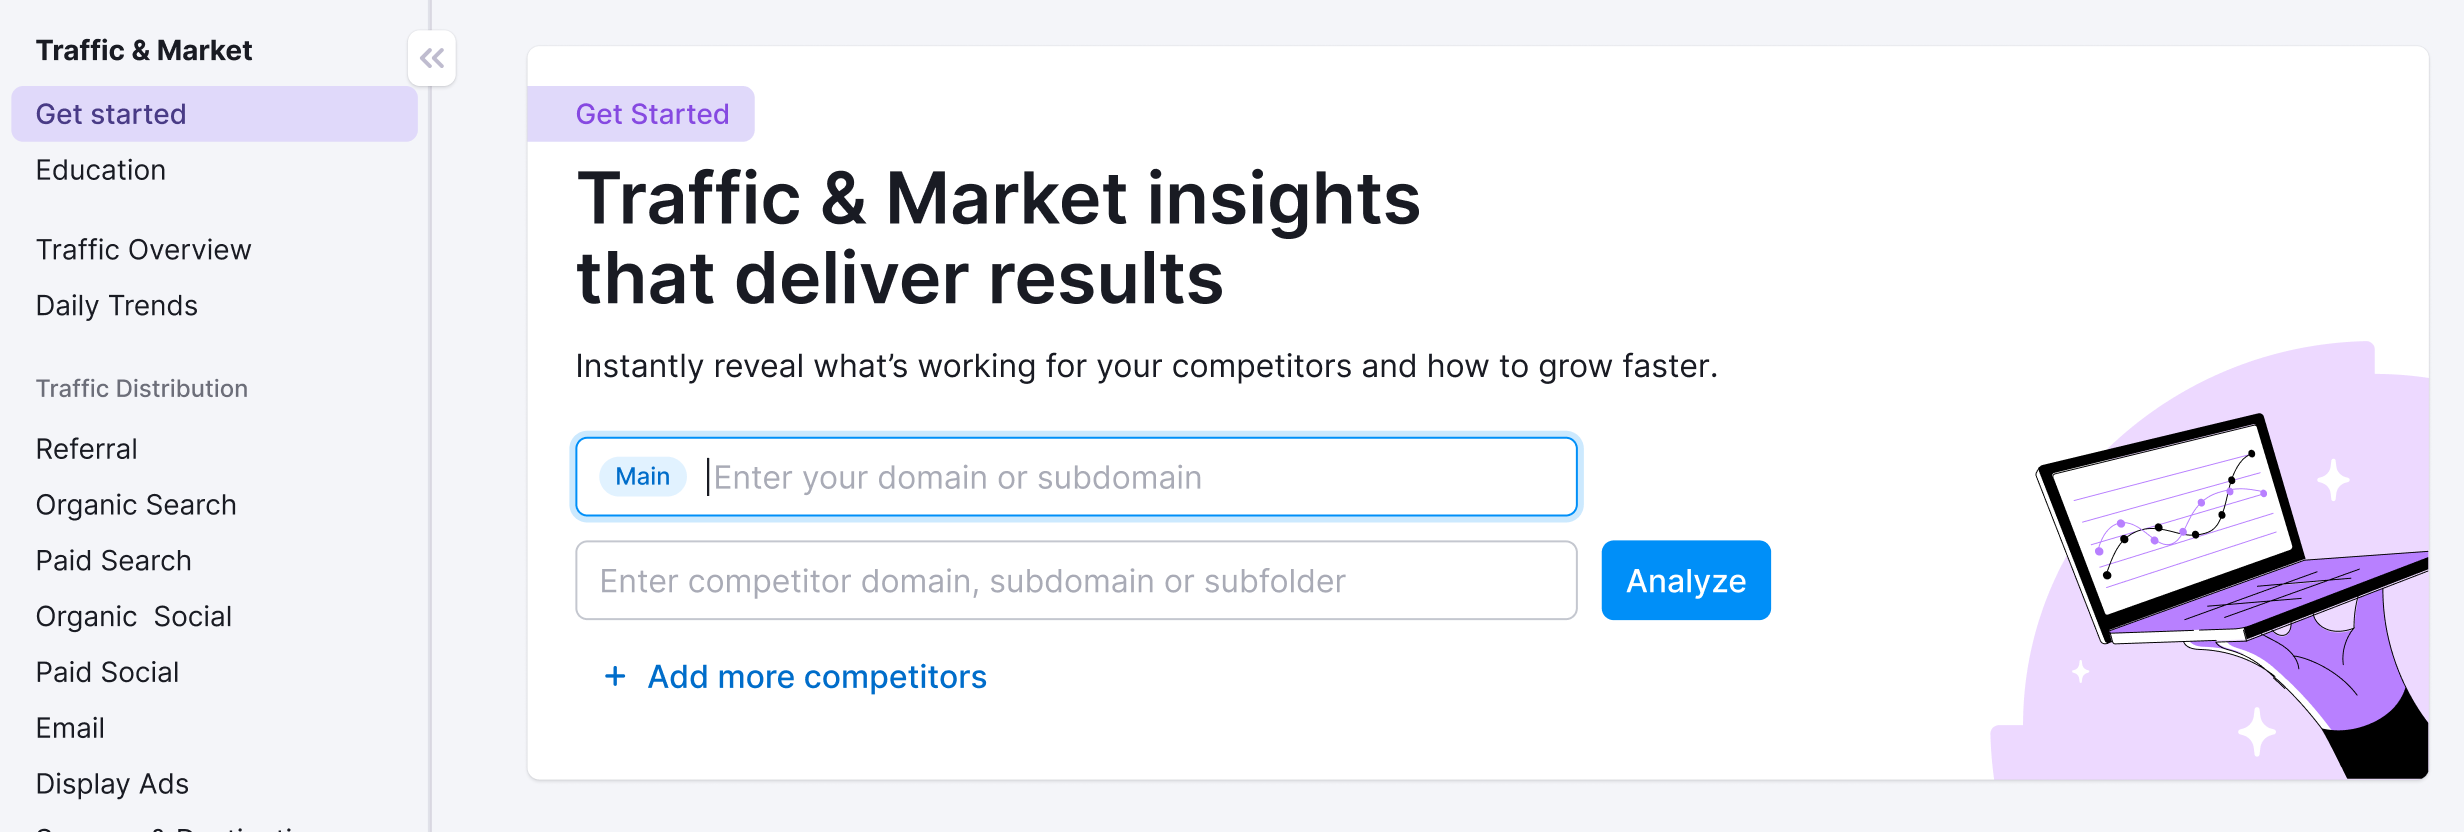
You’ll use this page to kick off your analysis—it’s your launchpad into the entire Traffic & Market experience.
If you haven’t started any analyses yet, you’ll see a search panel where you can:
- Type in a domain — Start by entering the main domain you’d like to analyze
- Add additional competitors — Use the “+ Add more competitors” link to compare multiple sites at once
- Click the “Analyze” button — This will pull up dashboards with data and charts, starting with the Traffic Analytics dashboard
If you’ve already entered domains into the toolkit, you’ll see them saved as “Folders” and you can access them anytime.
In this case, you’ll see your saved folders listed on the Get Started screen. Click any one of them to jump straight into your dashboards and pick up right where you left off.
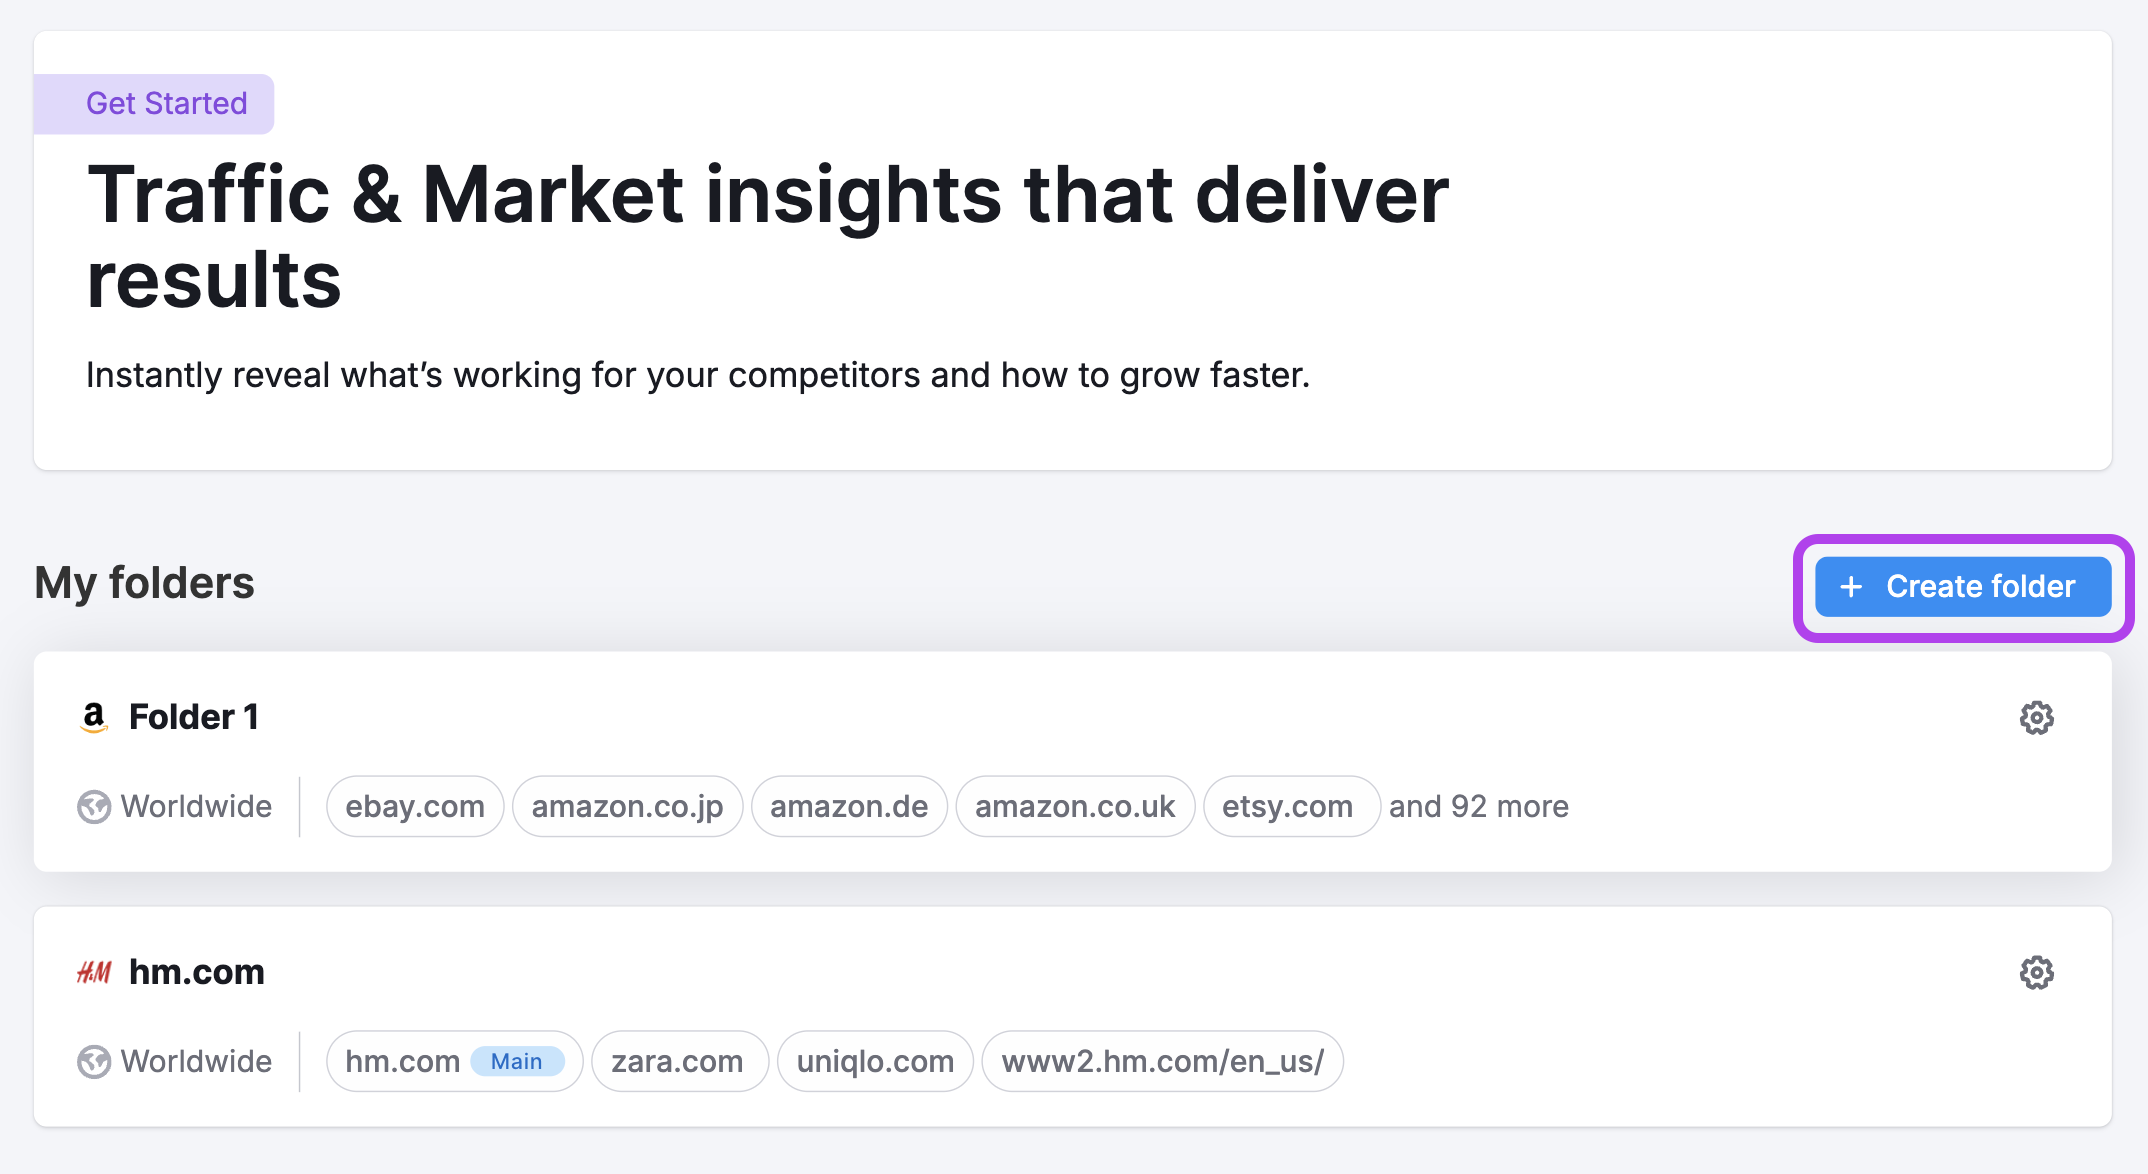
Use the “Create Folder” button to start a new project whenever you're analyzing a new domain or market.
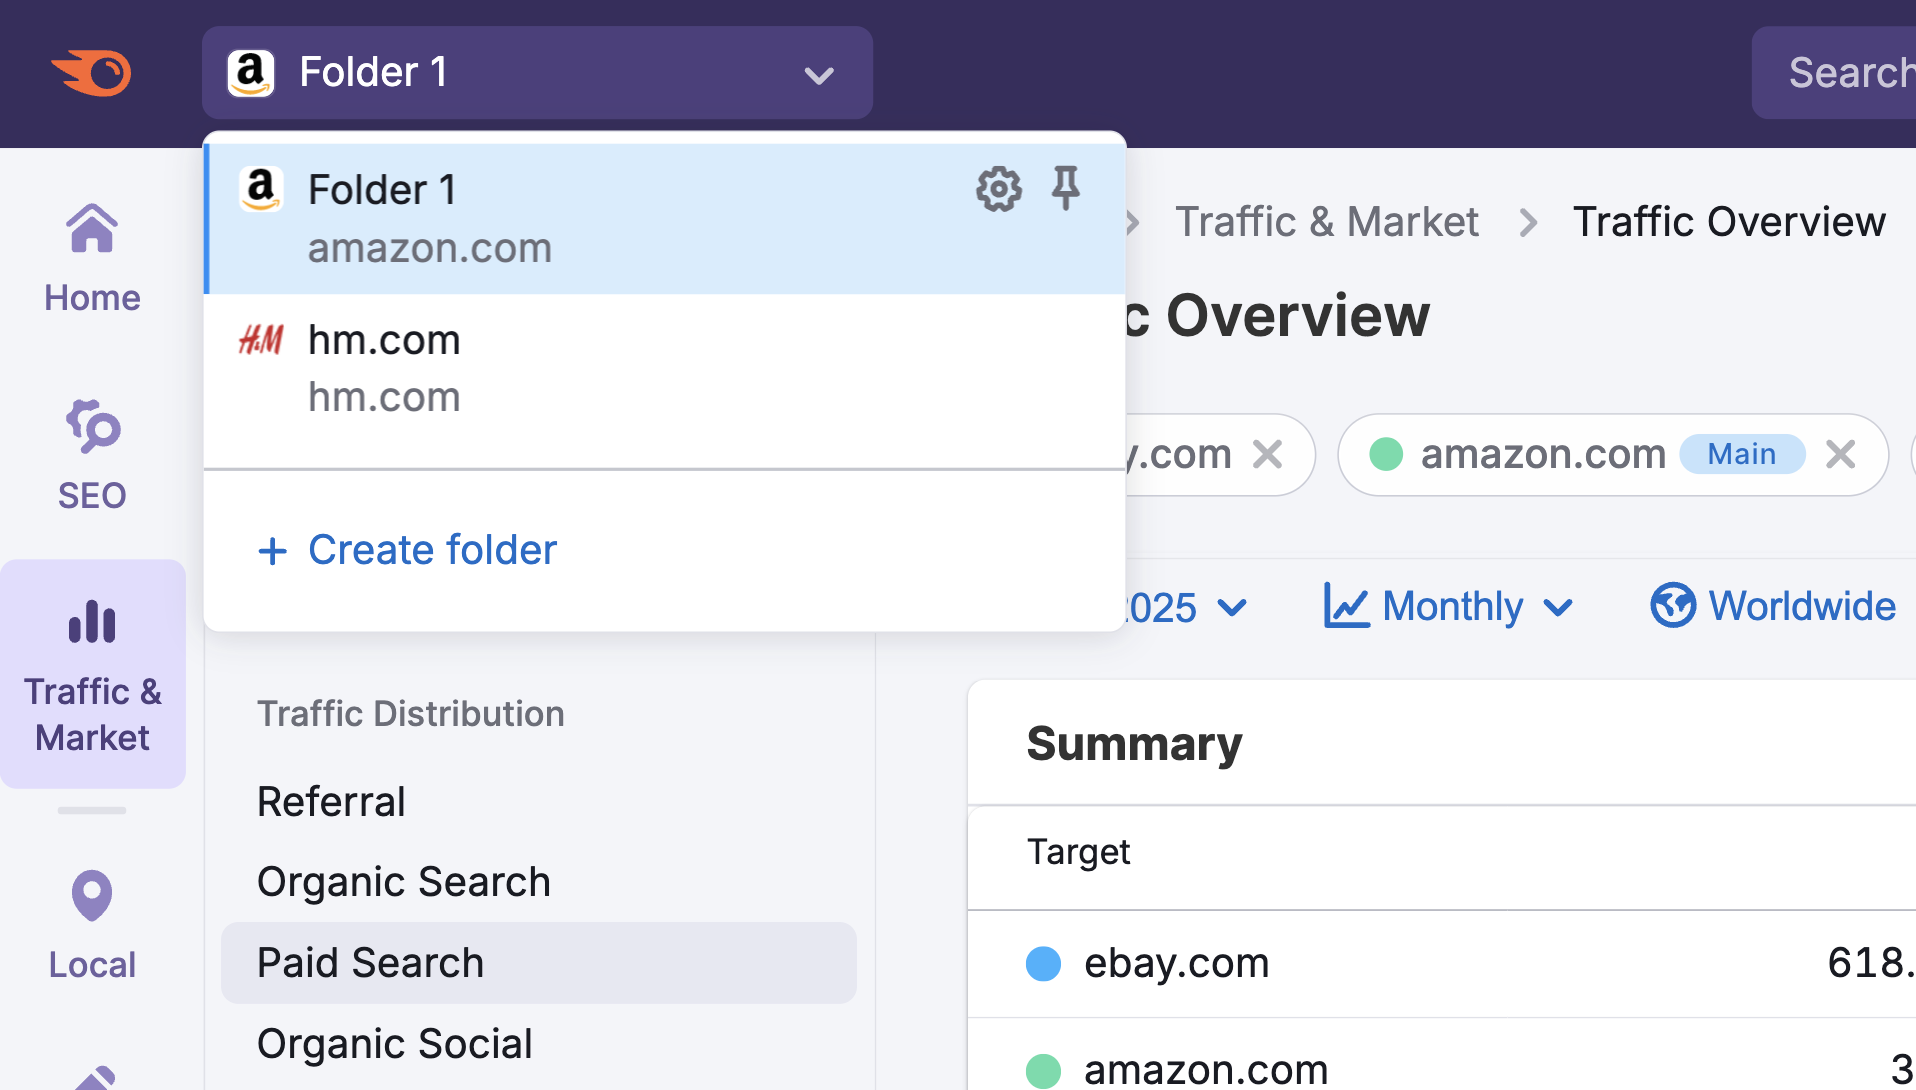
Note: At any time inside any dashboard, you can select the Competitor list drop-down in the upper left to edit your current list or create a different one without losing your place.
How to use the Sources & Destinations dashboard
The Sources & Destinations dashboard is interactive and customizable. Use the filters at the top of the page to tailor your analysis and explore traffic flows in detail. Start by selecting your date range, location, and device type preferences.
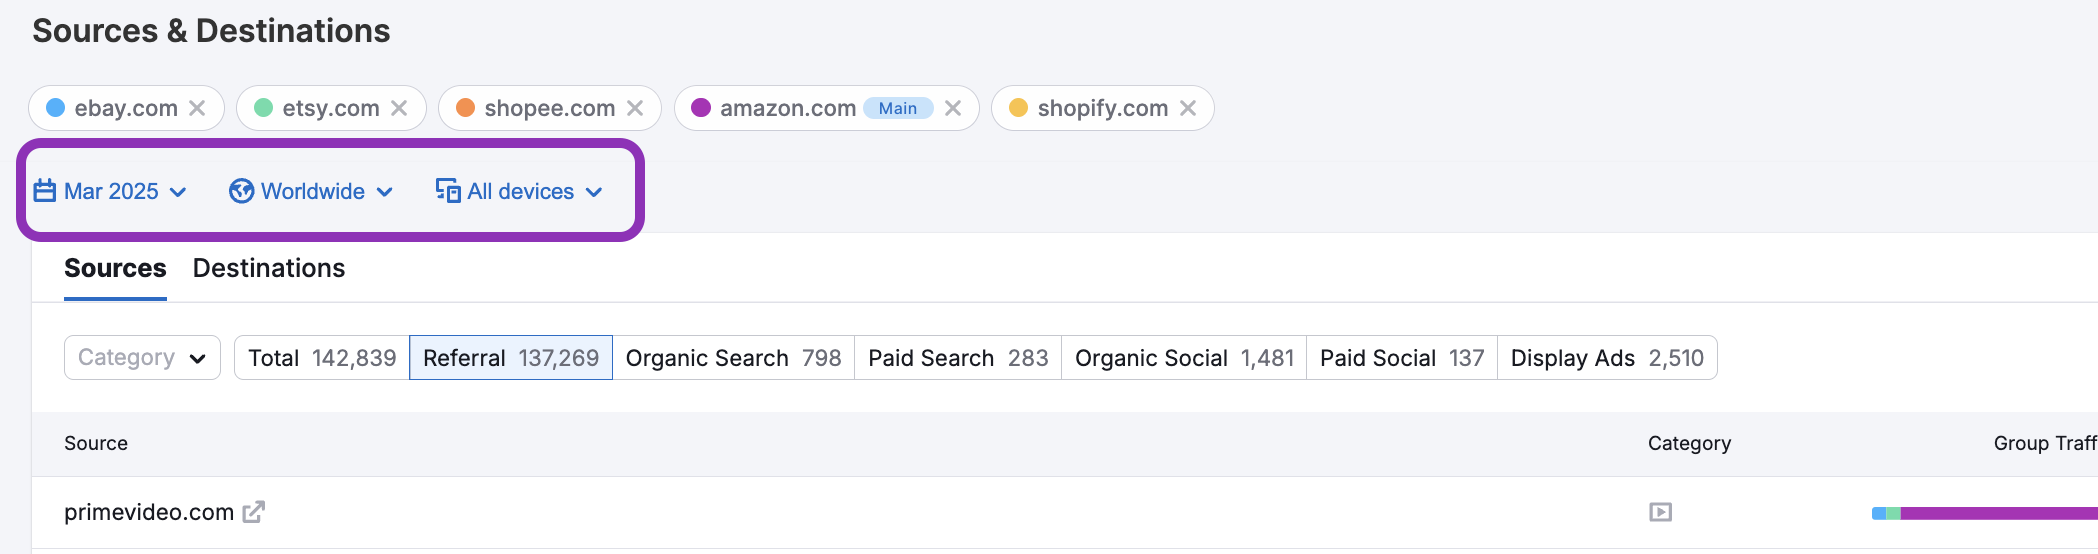
At the top of the dashboard, you'll see two tabs:
- Sources: Reveals the domain from which your analyzed domains’ traffic originates
- Destinations: Shows where users go after visiting the analyzed domains—critical for understanding post-visit behavior and possible churn or interest shifts
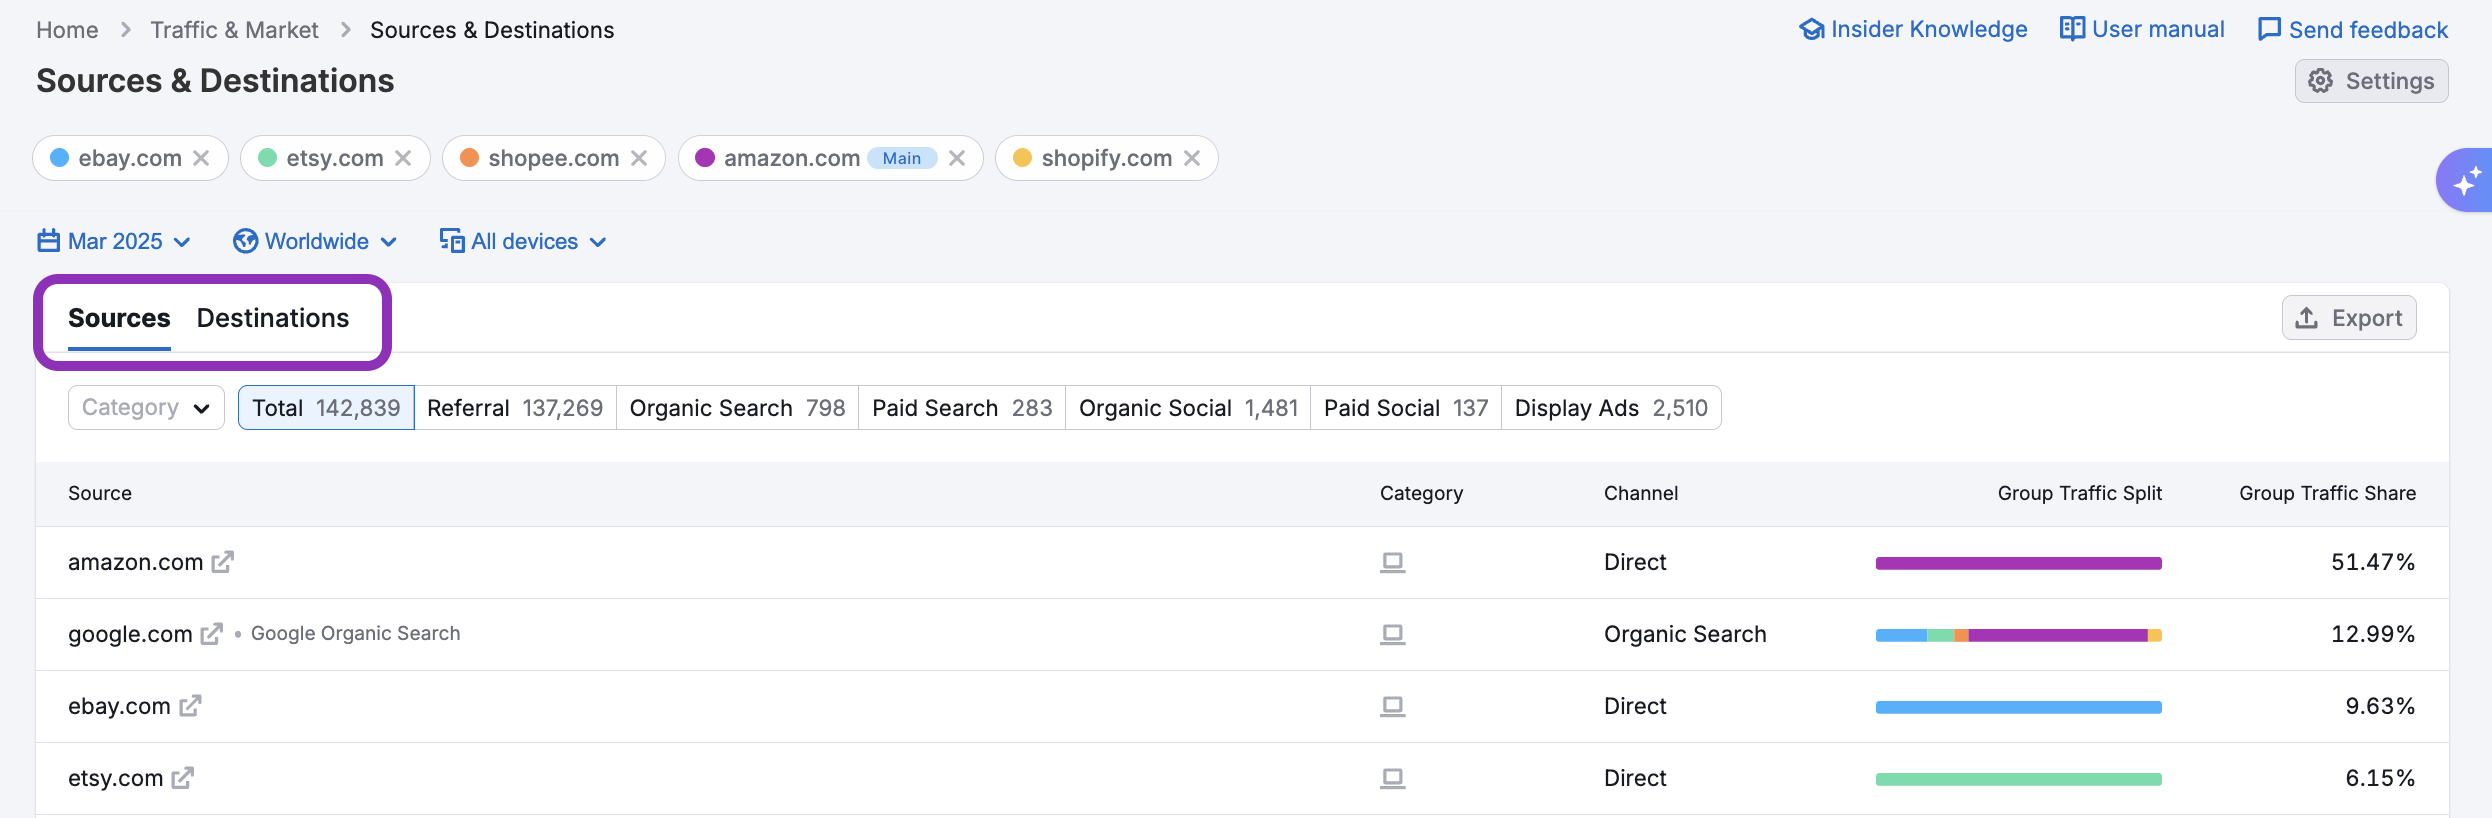
Switch between these tabs to gain a full-circle understanding of inbound and outbound traffic flows.
Each traffic source or destination is classified in two key ways—by industry category and by acquisition channel—to help you understand where traffic is coming from and how it was acquired.
Sources and destinations are grouped into industry verticals such as:
- Retail
- Apparel & Fashion
- Information Technology
- Food & Beverage
- Automotive
- Wellness
- And many more
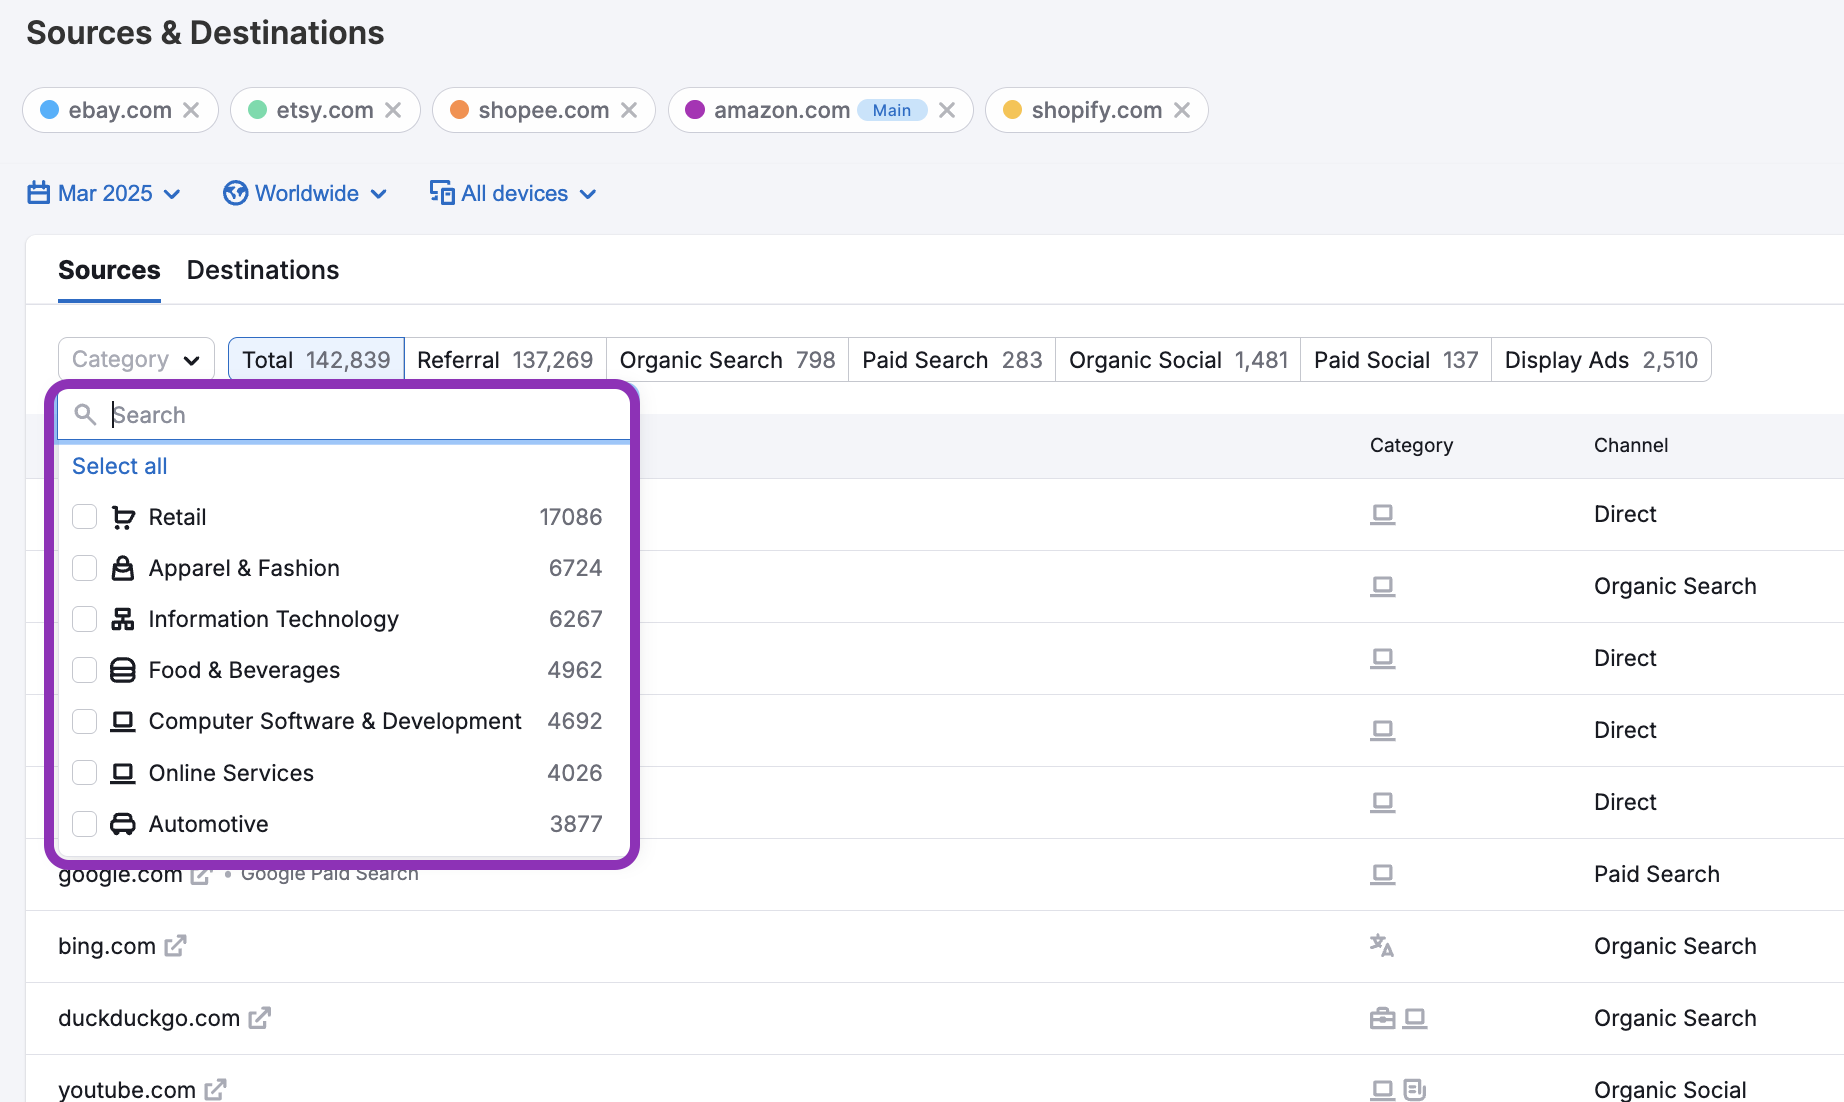
This helps you narrow your research and focus your efforts on the most relevant sectors.
Traffic channels provide additional context by showing how users arrived at or left a site. These include:
- Direct – Users typing a URL or using bookmarks
- Organic Search – Unpaid traffic from search engines
- Paid Search – Traffic from search engine ads
- Referral – Visits from links on other websites
- Organic Social – Traffic from unpaid social media content
- Paid Social – Traffic driven by paid social campaigns
- Display Ads – Traffic from banner and display advertising
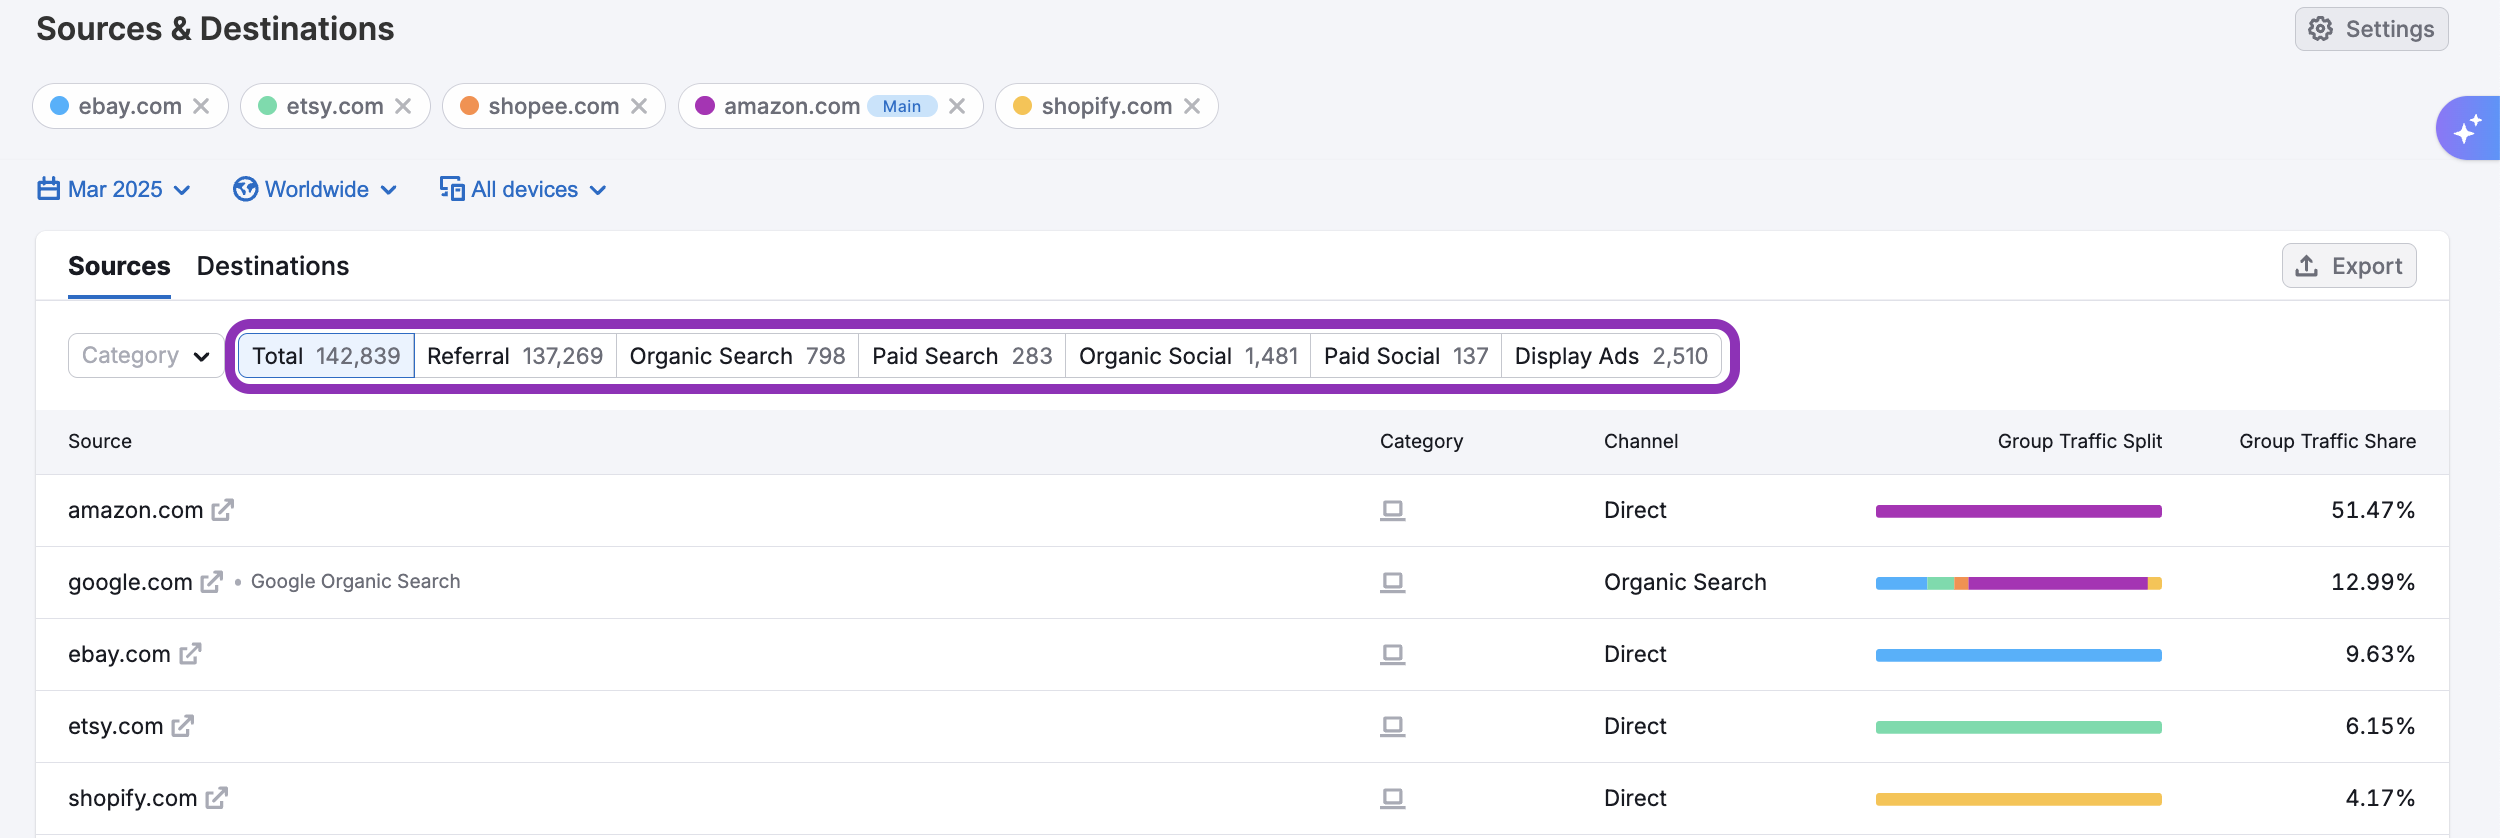
Together, category and channel give you a richer understanding of traffic patterns—making it easier to evaluate marketing performance, discover new sources, and benchmark against competitors.
Inside the table, you'll discover a variety of data points that give context to how each source or destination contributes to the overall traffic landscape.
- Source: The domain sending traffic to or receiving traffic from the analyzed websites; represents the origin or next step in the user journey.
- Category: The industry classification of the source or destination domain, such as Retail, Apparel, or IT.
- Group Traffic Split: A horizontal bar showing how traffic from that source is divided among your selected domains; hover to see total volume and percentage per domain.
- Group Traffic Share: The percentage of total group traffic that comes from or goes to this domain, showing its relative importance.
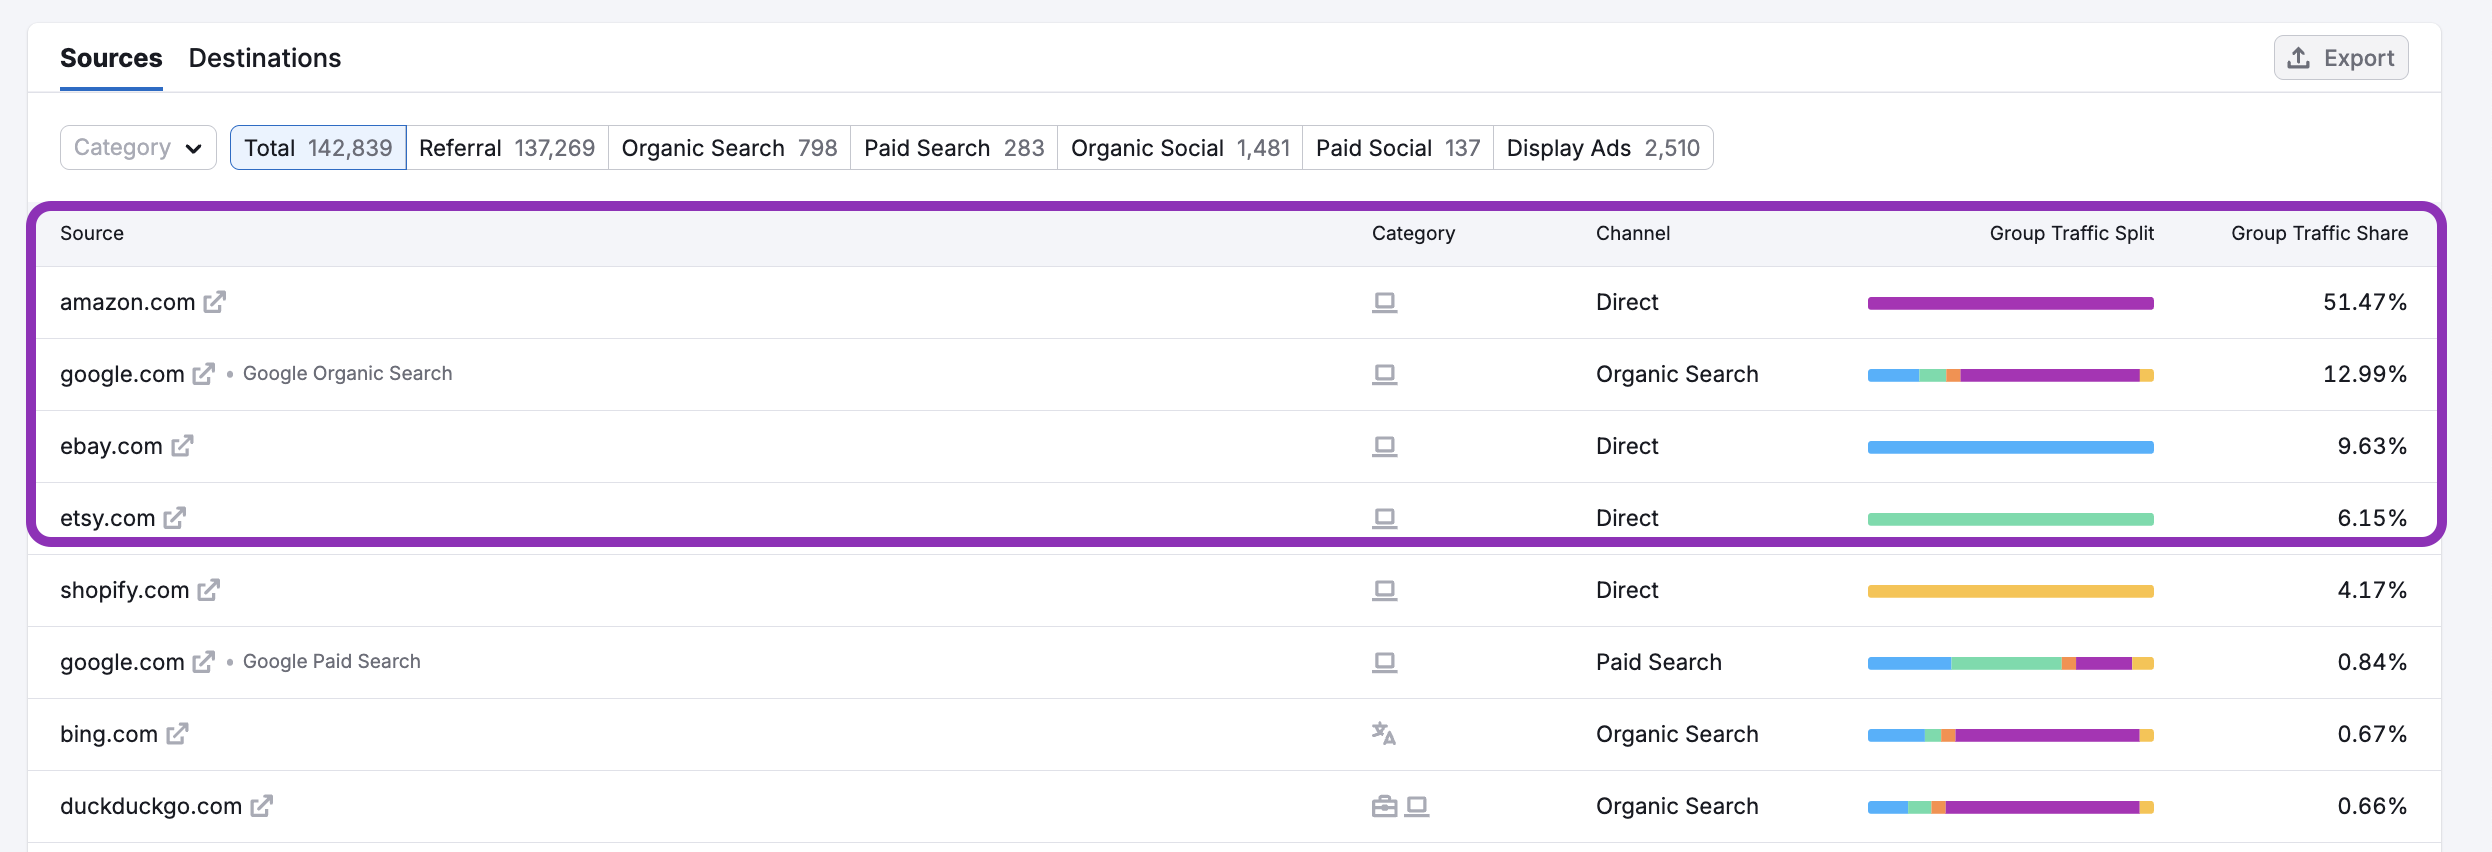
These metrics make it easy to identify major players sending and receiving traffic from your selected domains, spot shared traffic sources, and evaluate which domains command the most attention among your analyzed domains.
How can I act on the insights found in the Sources & Destinations dashboard?
The Sources & Destinations dashboard reveals the journey users take before and after visiting a domain—helping you uncover key acquisition sources, loyalty patterns, and emerging opportunities.
Here’s how you can use the data to take meaningful action:
- Identify top traffic sources: Invest in partnerships, ad placements, or content strategies on domains sending the most traffic to your competitors.
- Spot emerging trends: Monitor new or rising referrers and destinations over time to anticipate shifts in user behavior.
- Understand loyalty and leakage: The Destinations tab can show you whether users stick with a brand or move on to competitors.
- Benchmark: See how your domain stacks up against others across channels and categories to find opportunity gaps or strengths to double down on.
By regularly checking the Sources & Destinations dashboard, you can follow the full user journey—so you’re not just seeing who visits, but why and where they go next.
What related Traffic & Market dashboards should I use?
To get a complete picture alongside your Sources & Destinations insights, explore these related dashboards:
- Daily Trends – To track short-term changes in traffic, engagement, and specific channels on a daily level
- Referral Traffic – To understand which external sites drive traffic and how referral patterns vary across competitors
- Top Pages – To analyze a site’s content structure and identify which pages attract the most visits
- Market Overview – To benchmark domain performance against competitors and view overall market trends and share
- Audience Overlap – To compare audience intersections between multiple domains and uncover shared or unique reach
These dashboards complement Sources & Destinations by offering deeper insights into traffic sources, audience composition, market positioning, and performance benchmarking.