The Industry & Bulk Analysis dashboard in the Traffic & Market Toolkit delivers comprehensive competitive intelligence by allowing you to analyze up to 100 domains at once—either by manually entering domains or by selecting from 110 predefined industries.
This dashboard transforms complex web performance data into actionable insights about your competitive landscape. Whether you're a growth marketer, SEO specialist, or business analyst, you can instantly:
- Benchmark traffic volumes and conversion rates across multiple competitors
- Detect performance patterns across domains, subdomains, and subfolders
- Compare engagement metrics like bounce rate and visit duration
- Evaluate market positioning to identify leaders and emerging challengers
- Analyze top players and trends within predefined industries
With the flexibility to analyze individual competitors or entire industries, you can uncover opportunities and trends that guide smarter marketing, content, and investment decisions.
Getting started with the Industry & Bulk Analysis dashboard
To begin using the Industry & Bulk Analysis dashboard, select your preferred data settings at the top of the dashboard.
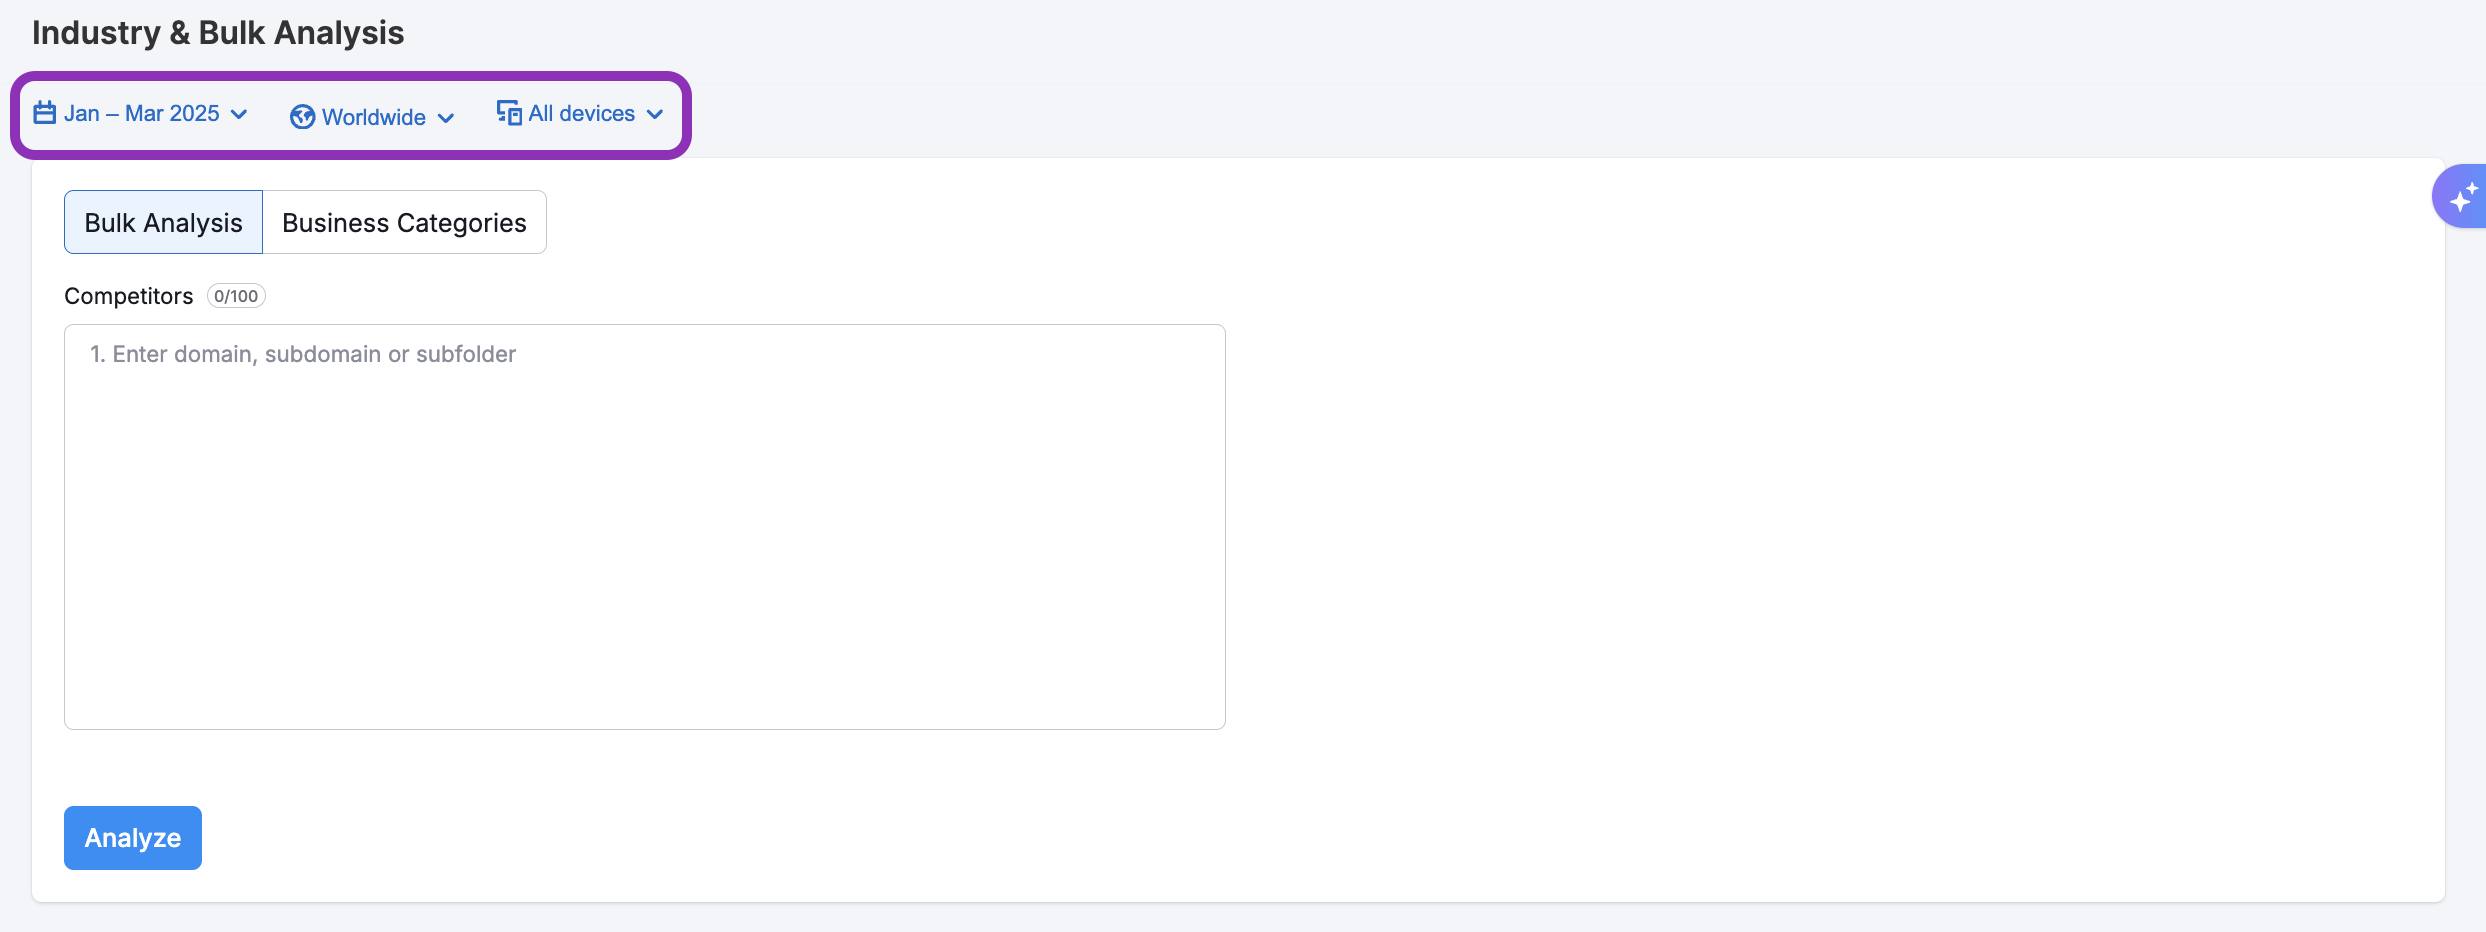
You can adjust:
- Date ranges (monthly or multi-month)
- Geographic locations (such as worldwide or by specific country)
- Device type (desktop, mobile, or all devices combined)
Next, choose how you want to run your analysis by choosing the Bulk Analysis or Business Categories tab.
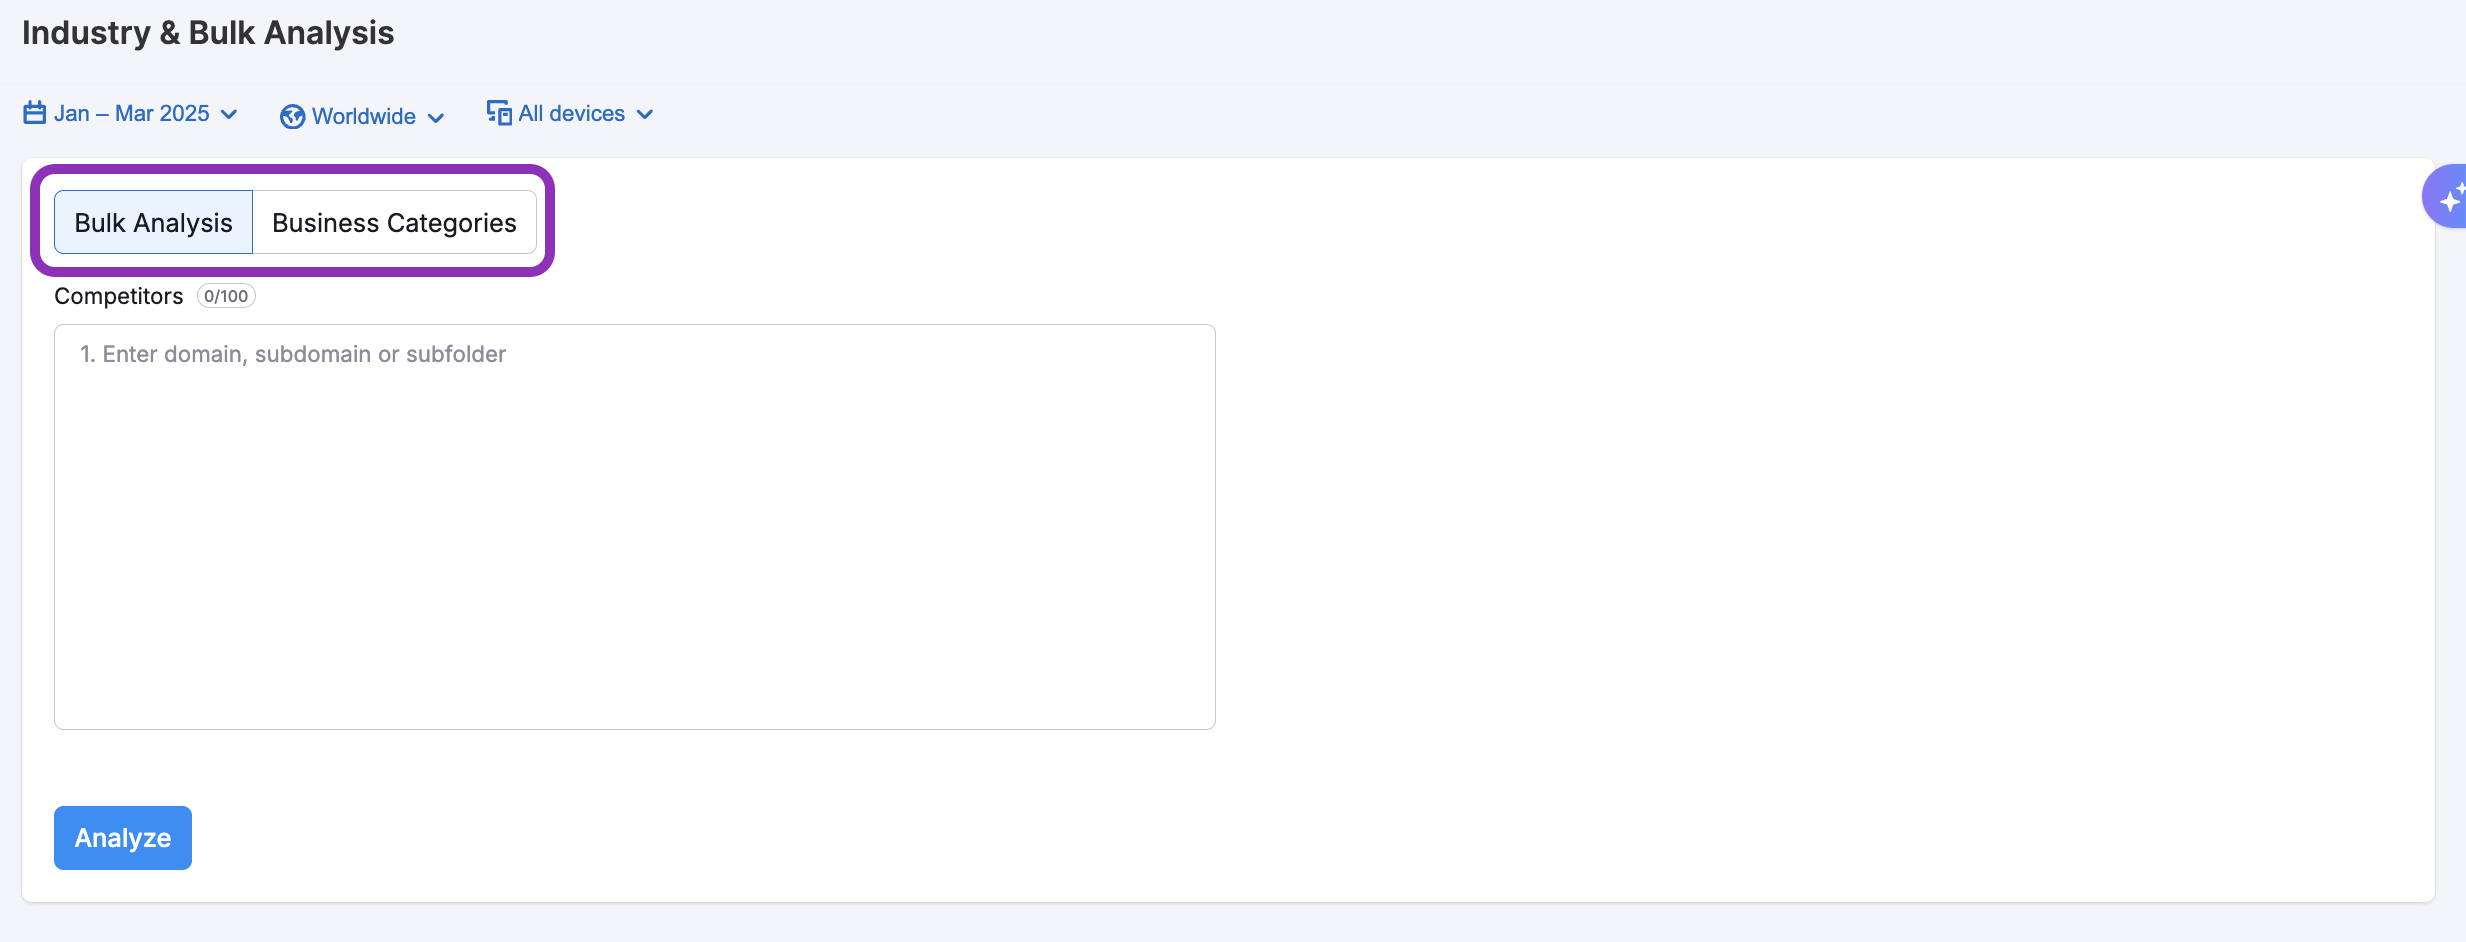
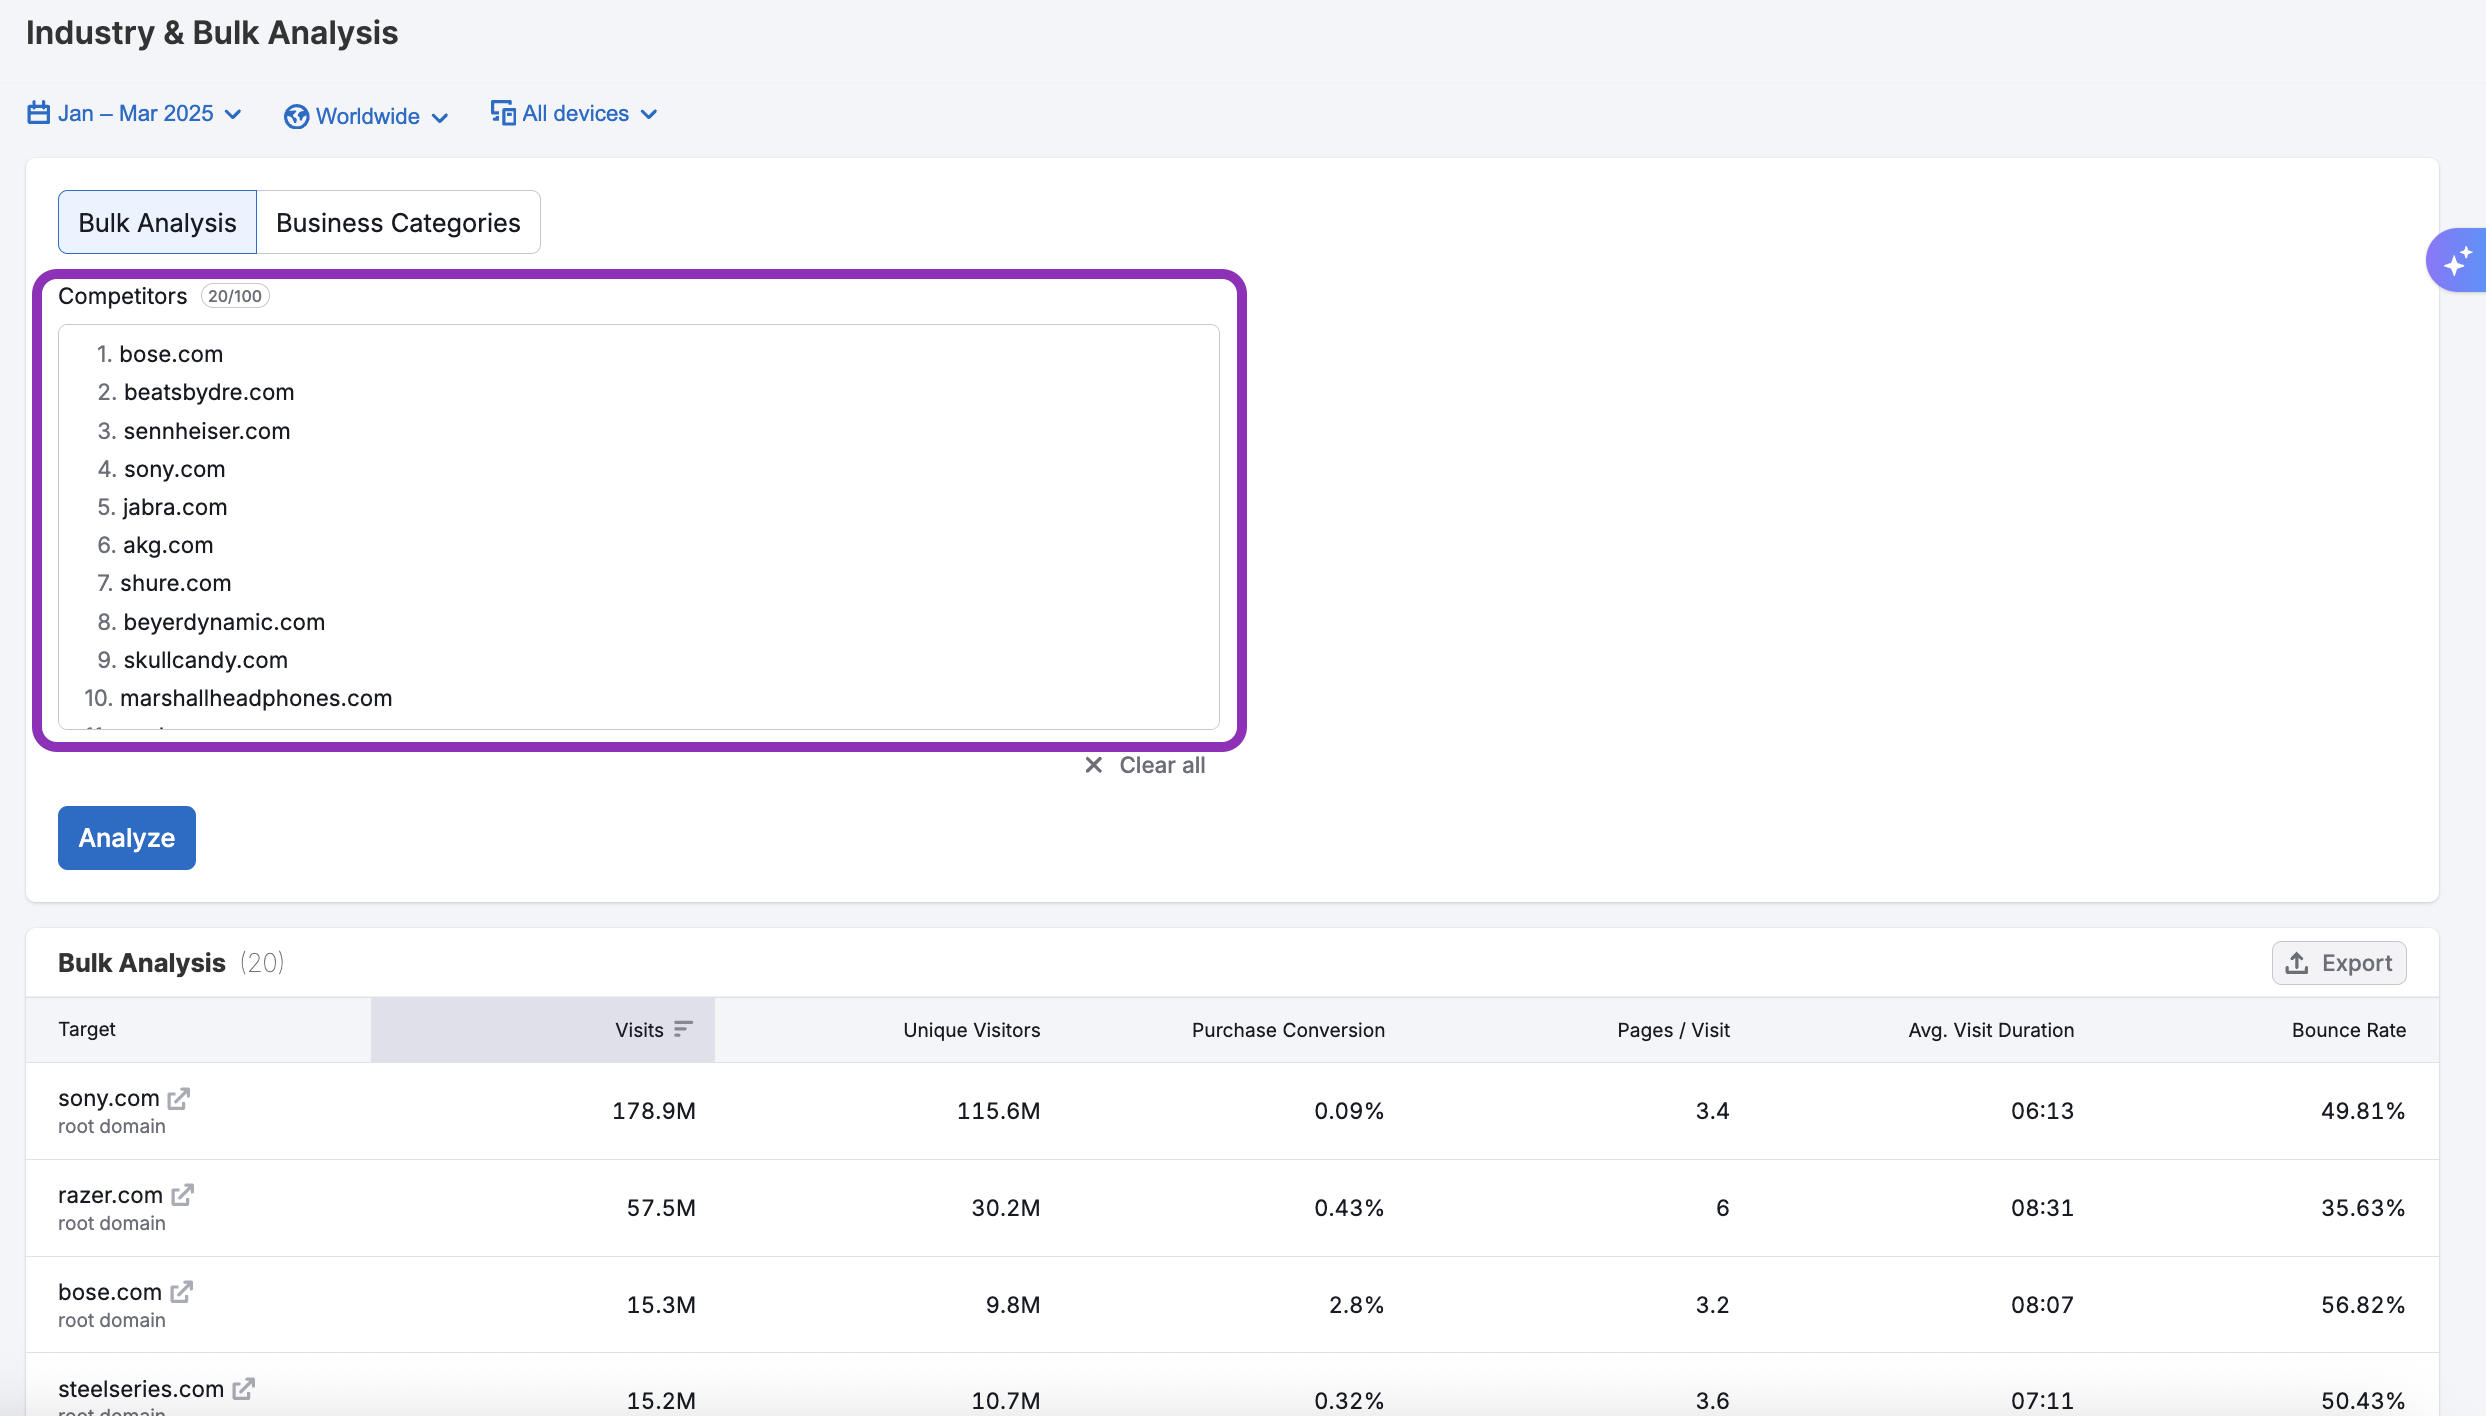
Select the Bulk Analysis tab if you have a list of specific competitors you'd like to analyze. You can manually enter up to 100 domains, subdomains, or subfolders, making this option ideal for comparing direct competitors or examining a curated set of brands you're actively tracking.
Select the Business Categories tab if you want to explore a broader market view. You’ll find a dropdown list of over 110 predefined industries—including sectors like Advertising & Marketing, Apparel & Fashion, Computer Software & Development, Food & Beverages, and many more.
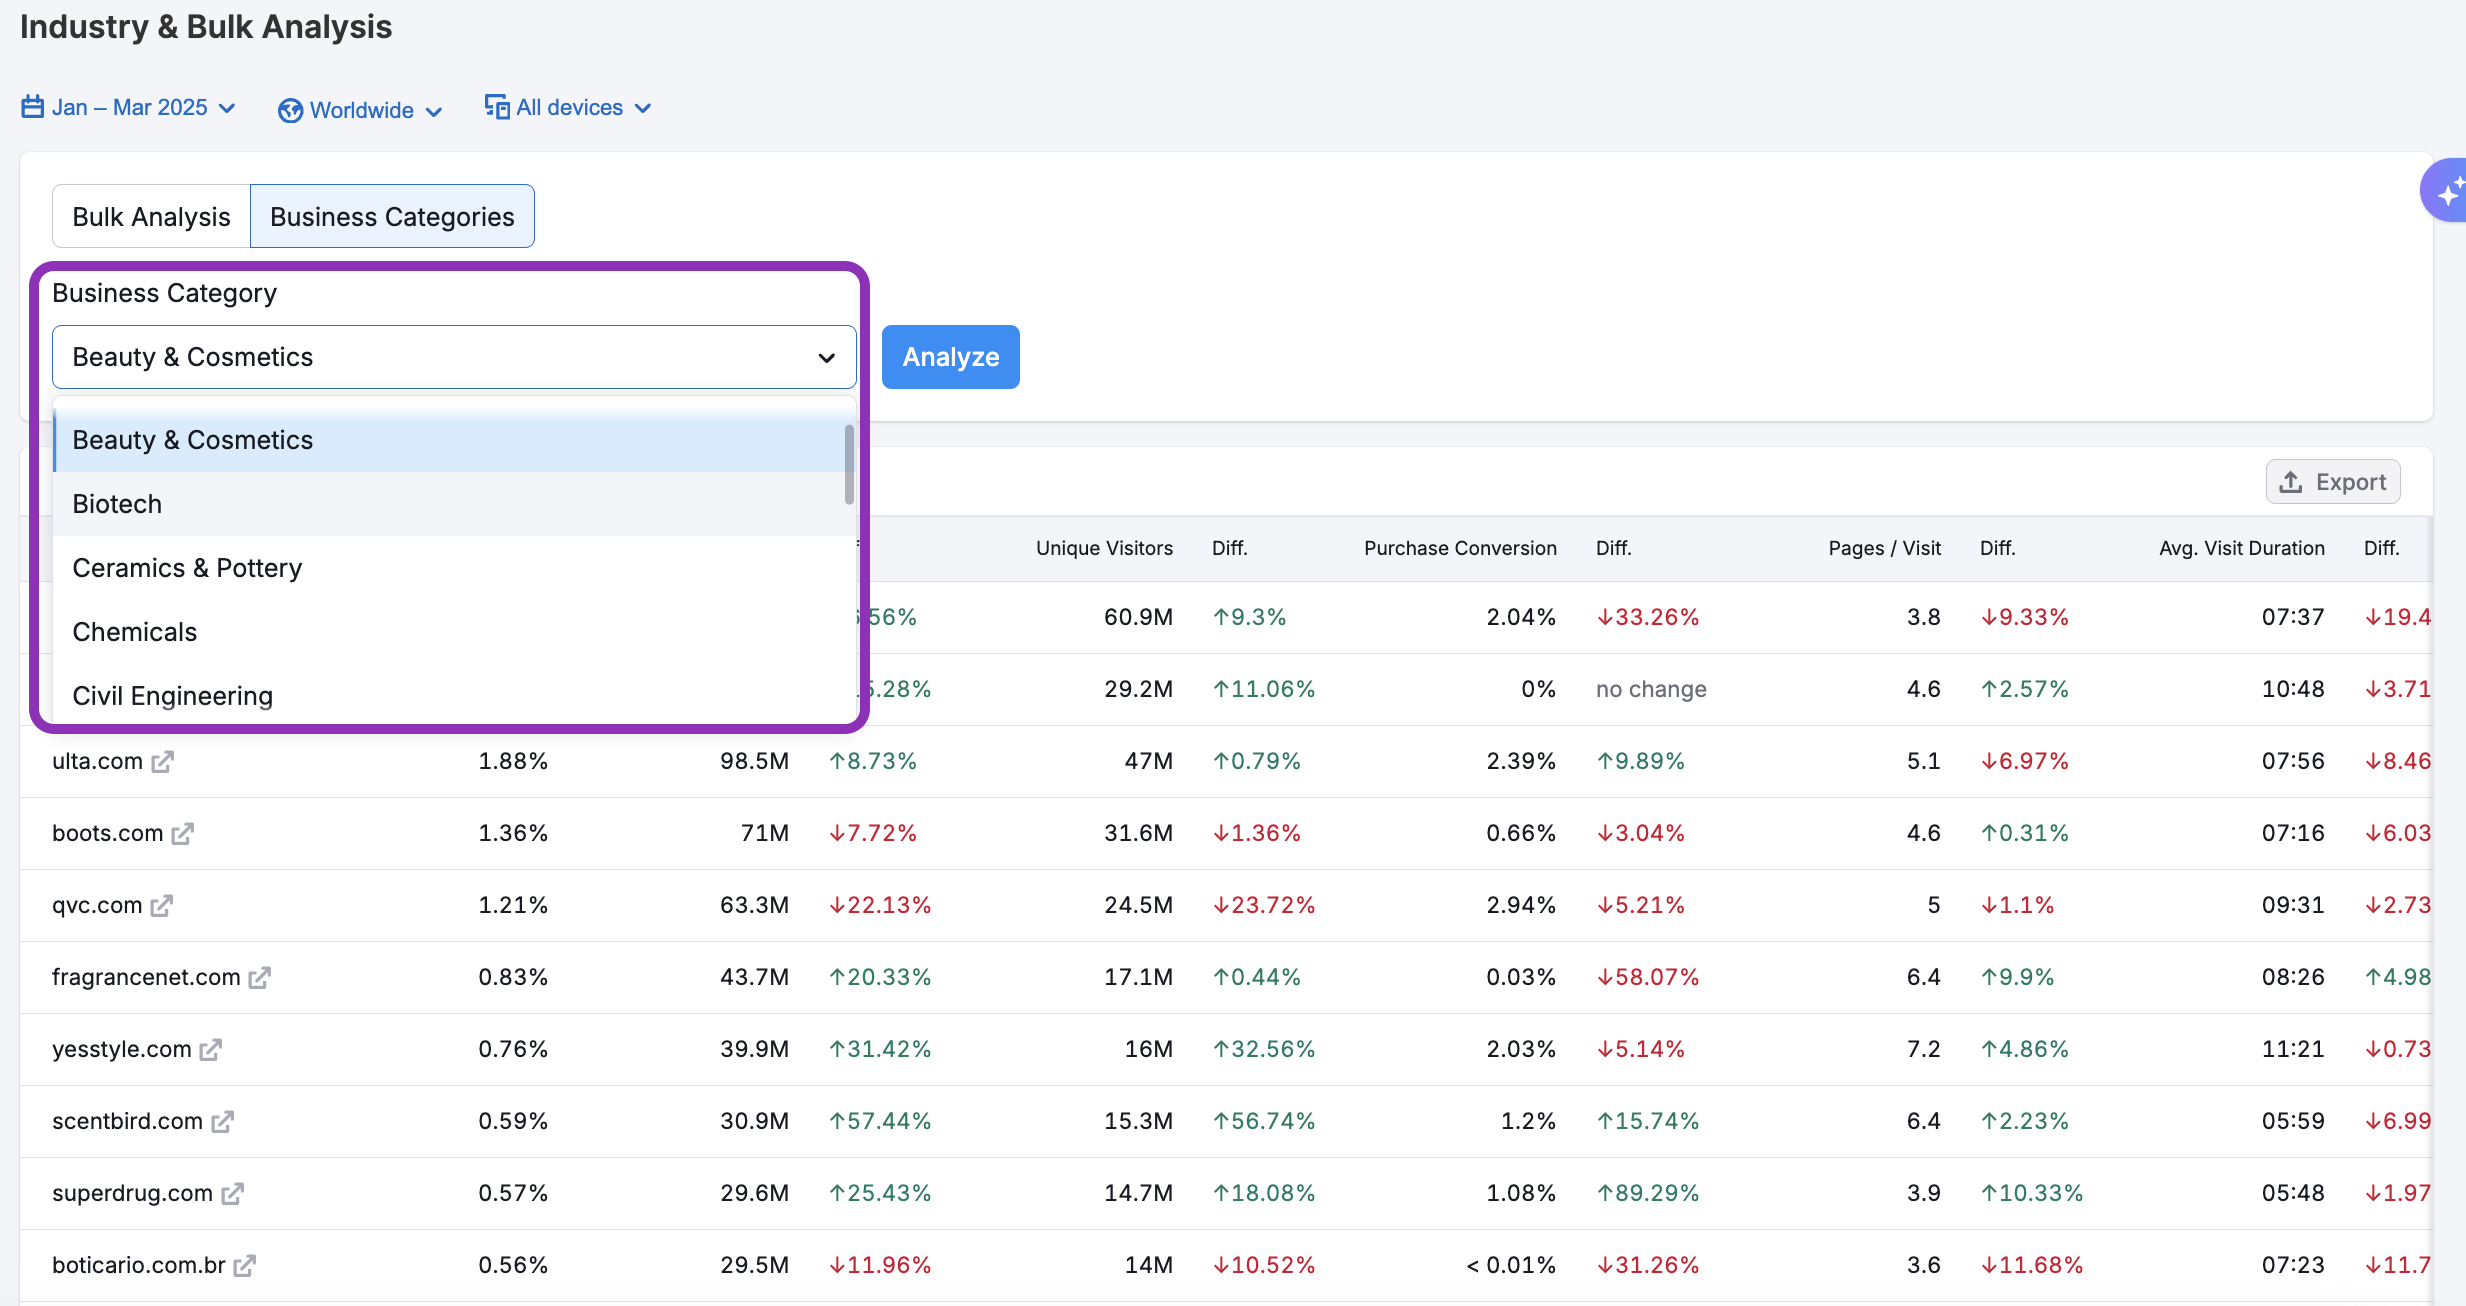
Once you choose a category, the dashboard will automatically generate a list of top market players within that space, giving you immediate access to industry-wide insights without needing to input domains manually.
After making your selections, simply click the Analyze button to generate your report and start uncovering valuable insights.
Industry & Bulk Analysis dashboard key features
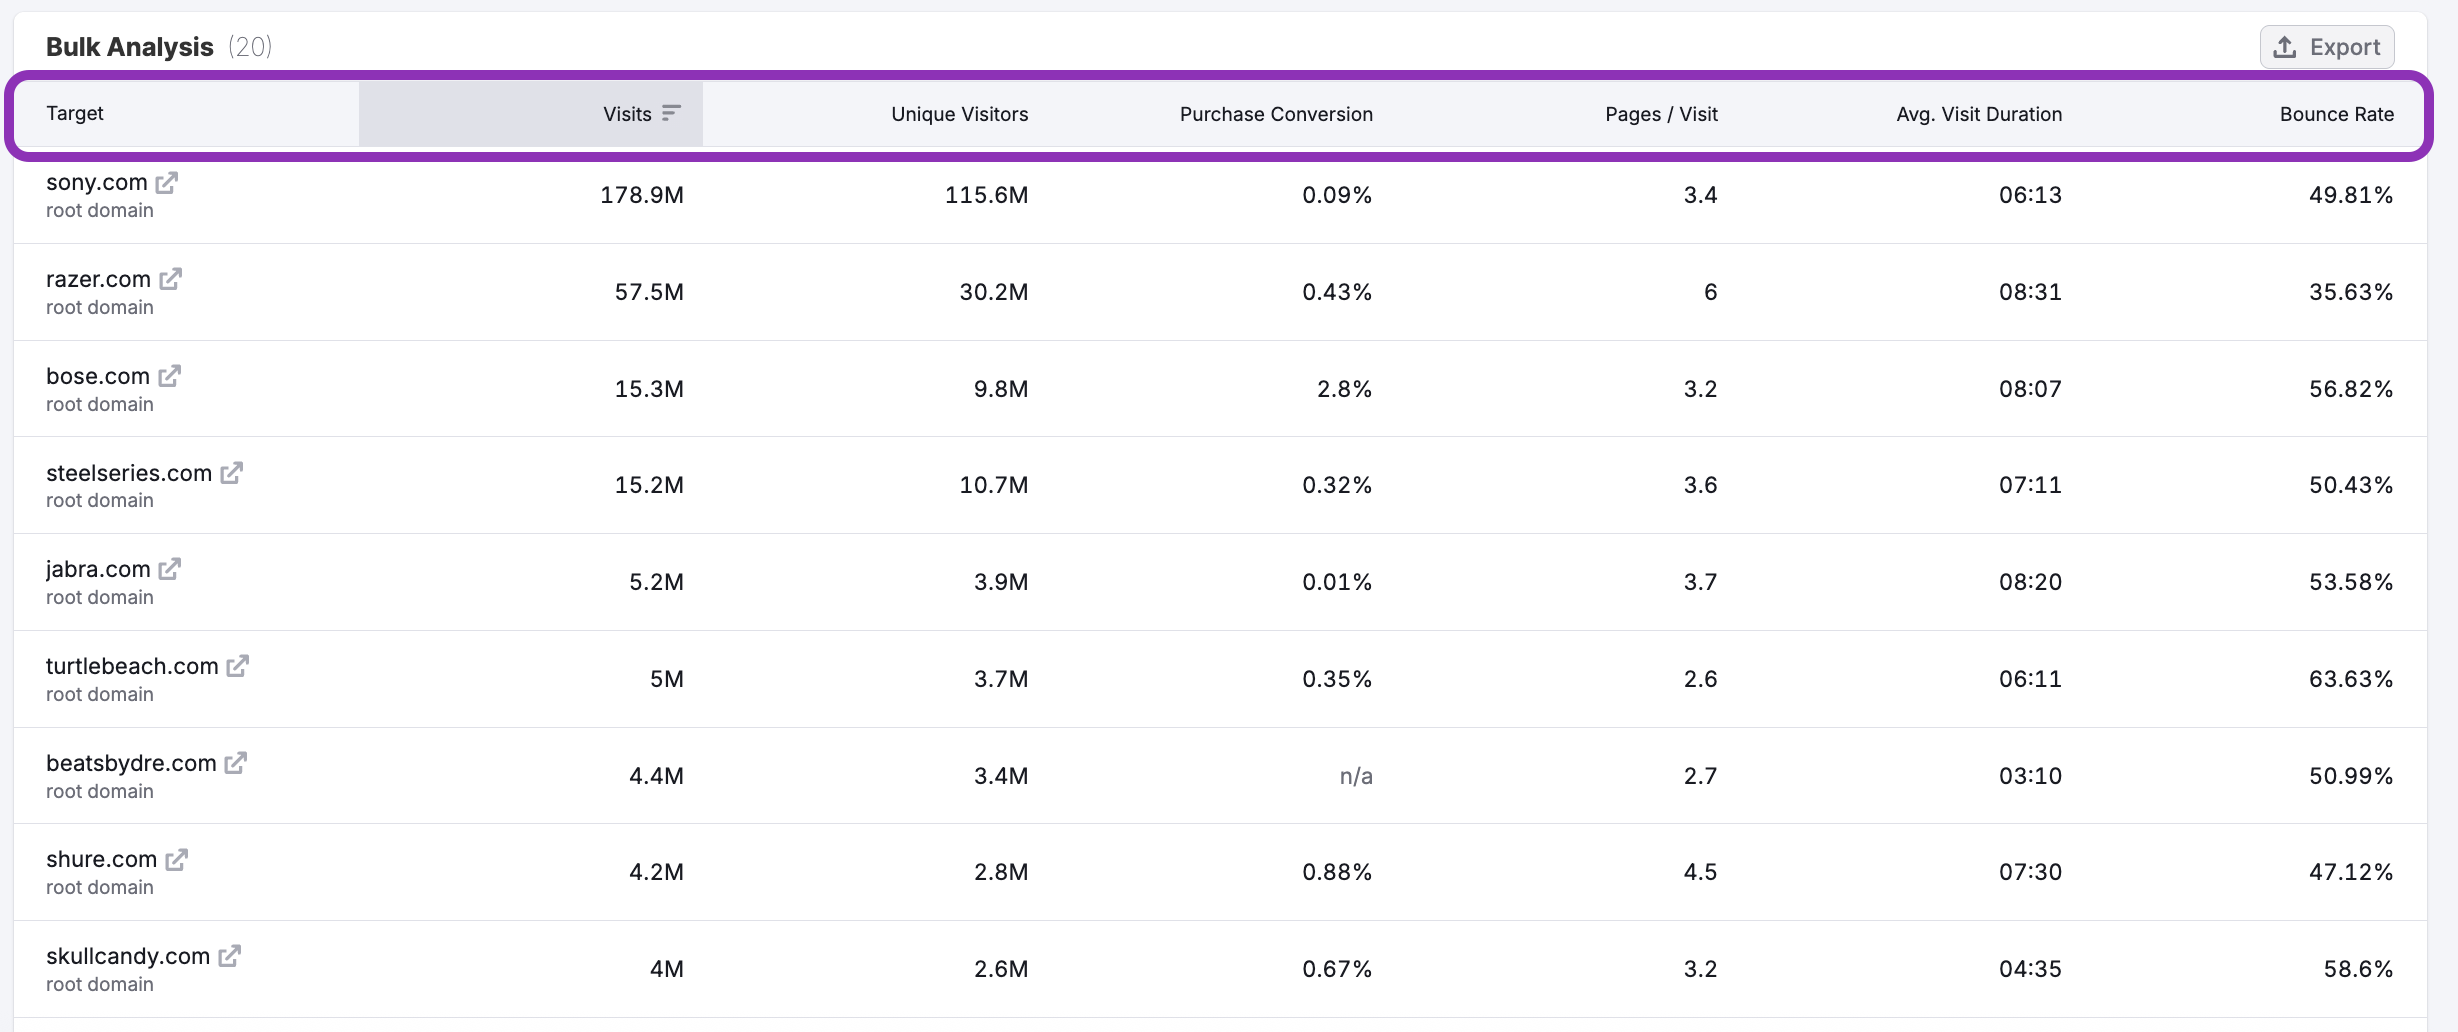
The dashboard presents an easy-to-read table that clearly reveals web performance across multiple domains, subdomains, and subfolders.
For both the Bulk Analysis and Business Categories options, you’ll discover the following data points:
- Visits – total visits during the designated timeframe
- Unique Visitors – how many distinct users visited the site
- Purchase Conversion – estimated percentage of sessions that ended with a checkout
- Pages per Visit – average number of pages viewed
- Avg. Visit Duration – time spent per session
- Bounce Rate – percentage of sessions with no interaction
When using the Business Categories option you’ll also discover traffic data for the following channels:
- Direct
- Referral
- Organic Search
- Paid Search
- Organic Social
- Paid Social
- Display Ads
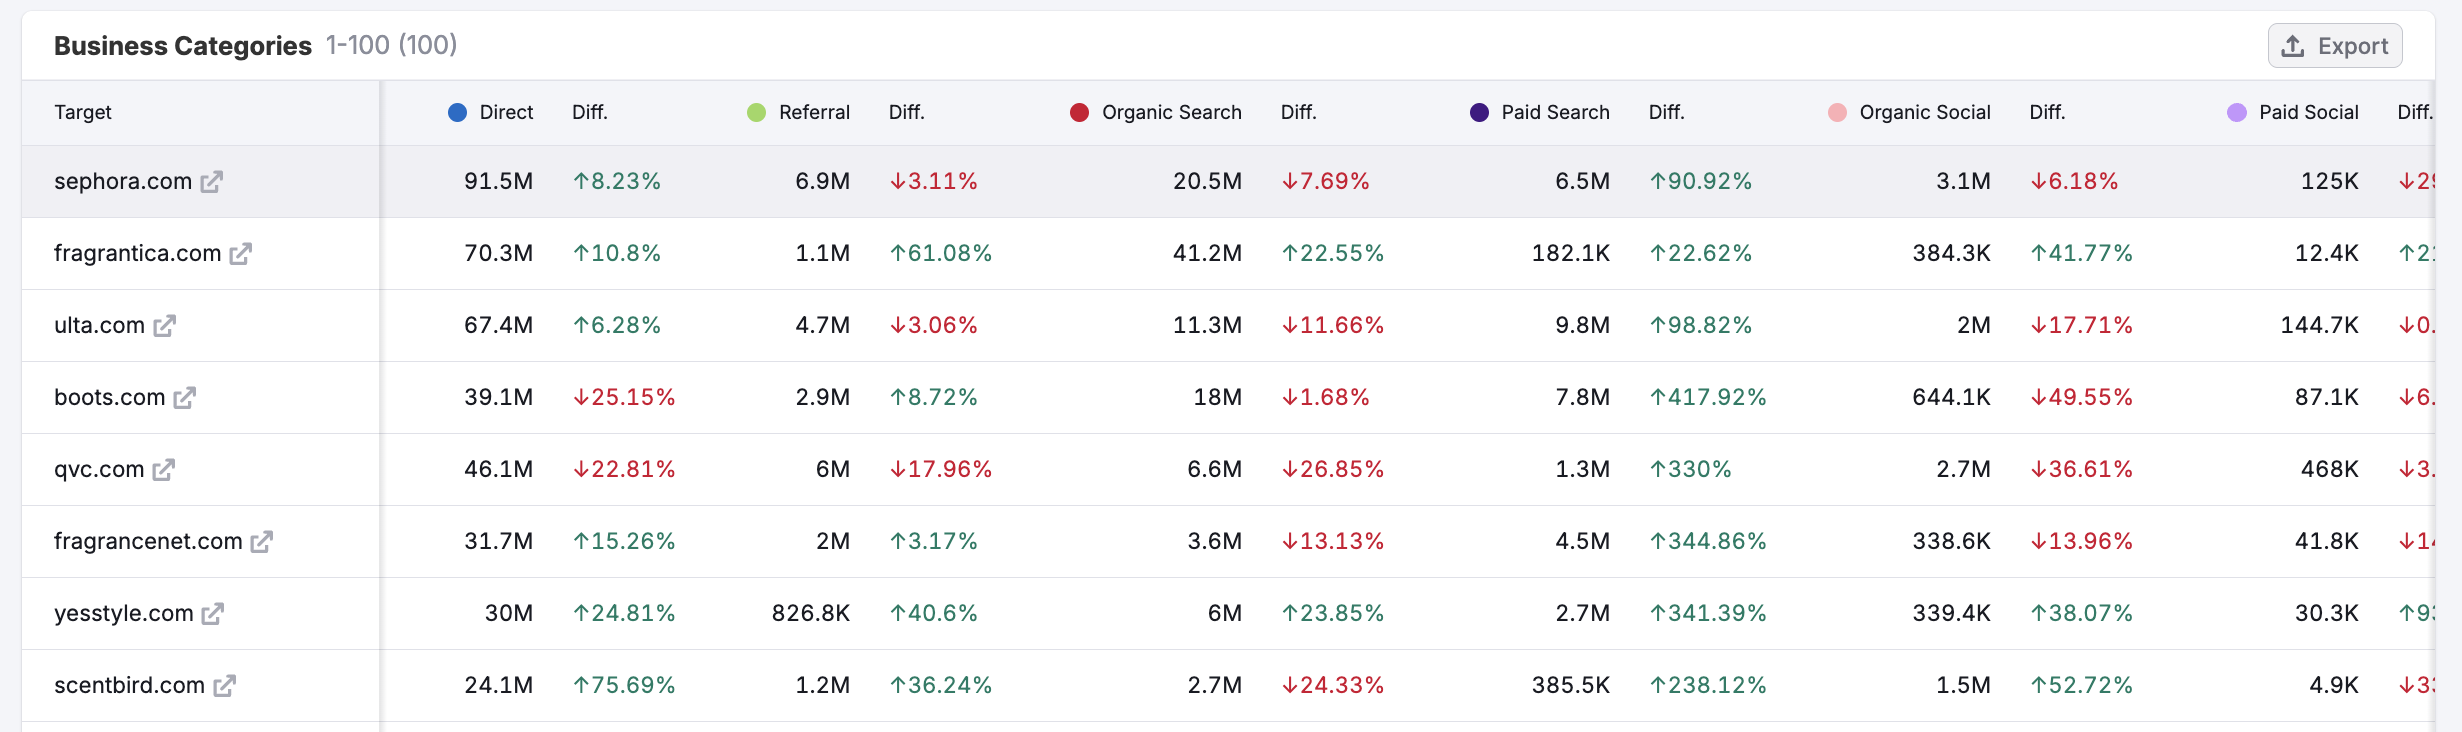
You can filter the table by clicking the tab at the top of each column, bringing the highest performing domains to the top by metric. The data found here can help you quickly benchmark engagement, spot performance issues, and understand how users interact across multiple sites.
How can I act on the insights found in these dashboards?
The Industry & Bulk Analysis dashboard lets you evaluate multiple domains simultaneously, giving you a comprehensive view of your competitive landscape.
Here's how this dashboard delivers actionable insights across domains:
See the whole competitive field in one view
Compare traffic volumes, engagement metrics, and conversion rates across multiple domains to identify market leaders and emerging challengers. The side-by-side metrics make it easy to spot which sites are gaining traction and which are losing ground.
Detect patterns across domain types
Whether you're analyzing root domains, subdomains, or specific subfolders, the Industry & Bulk Analysis dash reveals which structural approaches drive the strongest performance. Use these insights to inform your own site architecture decisions.
Benchmark essential engagement metrics
Go beyond basic traffic numbers to understand how visitors interact with each site. Metrics like average visit duration and bounce rate help determine which competitors deliver the most compelling user experience.
Evaluate market positioning
The table helps you benchmark your domain against your leading competitors. In an instant, the data will tell you if you're a market leader or need to gain market share to catch up to the pack.
With consistent use of the Industry & Bulk Analysis dashboard, you'll develop a clearer picture of your competitive position, turning raw data into a competitive advantage.
Where does Semrush traffic data come from?
Traffic Analytics reports are based on petabytes of clickstream data that comes from multiple proprietary and 3rd party data sources, Semrush’s proprietary AI and machine learning algorithms, and Big Data technologies. The data is accumulated and approximated from the user behavior of over 200 million real internet users, and over a hundred different apps and browser extensions are used to collect it.
For more information about how Semrush turns traffic data into traffic intelligence, refer to our article here.
As Traffic Analytics data is not obtained from any website’s internal analytics, the numbers you see here might differ from what you see in your Google Analytics or similar trackers you use. However, if you want to analyze only your own website traffic without comparing it with others, we recommend that you refer to your own Google Analytics.
All numbers in Semrush Traffic Analytics are perfectly comparable, meaning you can match two or more websites in the tool and see how their metrics differ from each other in %.
What related Traffic & Market dashboards should I use?
To expand your analysis, pair the Traffic Overview dashboard with:
- Daily Trends Dashboard – To track short-term changes in traffic, engagement, and specific channels on a daily level
- Channel-Specific Dashboards – Like Organic Search or Paid Social for detailed trends, sources, and top-performing pages
- Sources & Destinations – To visualize where users came from and where they went next, helping identify referral partners or exit paths
- Top Pages, Subfolders & Subdomains – To analyze the site’s content structure and identify which areas drive the most visits
- Market Overview – To benchmark domain performance against competitors and see overall market trends and share
- Audience Overlap – To compare audience intersections between multiple domains and spot shared or unique reach